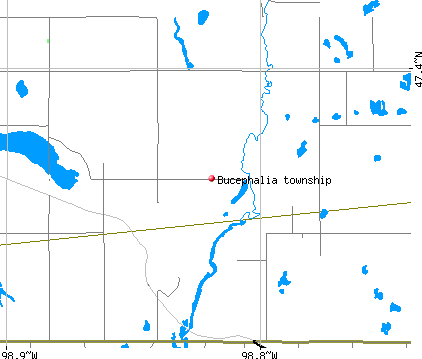
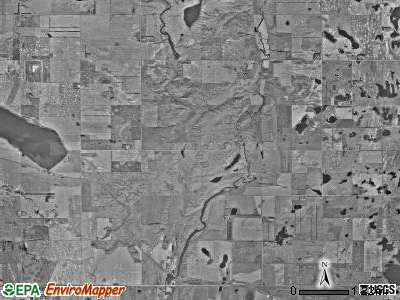
Bucephalia township, Foster County, North Dakota (ND) detailed profile
Number of foreign born residents: 16 (100% naturalized citizens)
| Bucephalia township: | 16.4% |
| Whole state: | 1.9% |
61% of Bucephalia township residents lived in the same house 5 years ago.
Out of people who lived in different houses, 47% lived in this county.
Out of people who lived in different counties, 55% lived in North Dakota.
Place of birth for U.S.-born residents:
- This state: 924
- Northeast: 18
- Midwest: 122
- South: 33
- West: 37
Median price asked for vacant for-sale houses in 2000: $80,000
Percentage of households with unmarried partners: 0.0%
No gay or lesbian households reported
Housing units in structures:
- One, detached: 759
- One, attached: 2
- Two: 4
- Mobile homes: 172
- Boats, RVs, vans, etc.: 2
Median worth of mobile homes: $26,900
Housing units in Bucephalia township with a mortgage: 139 (19 second mortgage, 2 home equity loan, 0 both second mortgage and home equity loan)
Houses without a mortgage: 146
- Construction (21%)
- Metal and metal products (10%)
- Educational services (6%)
- Agriculture, forestry, fishing and hunting (5%)
- Accommodation and food services (4%)
- Furniture and related product manufacturing (4%)
- Food and beverage stores (4%)
- Health care (19%)
- Accommodation and food services (13%)
- Metal and metal products (7%)
- Administrative and support and waste management services (6%)
- Educational services (5%)
- Used merchandise, gift, novelty, and souvenir, and other miscellaneous stores (4%)
- Professional, scientific, and technical services (4%)
- Metal workers and plastic workers (8%)
- Carpenters (6%)
- Other production occupations including supervisors (6%)
- Electrical equipment mechanics and other installation, maintenance, and repair occupations including supervisors (6%)
- Construction trades workers except carpenters, electricians, painters, plumbers, and construction laborers (4%)
- Construction laborers (4%)
- Other management occupations except farmers and farm managers (4%)
- Building and grounds cleaning and maintenance occupations (7%)
- Other production occupations including supervisors (7%)
- Health technologists and technicians (7%)
- Other sales and related workers including supervisors (5%)
- Waiters and waitresses (5%)
- Agricultural workers including supervisors (4%)
- Secretaries and administrative assistants (4%)
Most common first ancestries reported in Bucephalia township:
- German (28.0%)
- United States or American (9.6%)
- English (7.7%)
- Irish (7.3%)
- Dutch (6.7%)
- Polish (5.2%)
- French (except Basque) (4.7%)
Most common places of birth for the foreign-born residents:
- Canada (40%)
- United Kingdom (30%)
- Netherlands (30%)
Means of transportation to work:
- Drove a car alone: 363 (80%)
- Carpooled: 65 (14%)
- Walked: 3 (1%)
- Worked at home: 22 (5%)
Most commonly used house heating fuel:
- Bottled, tank, or LP gas (58%)
- Wood (16%)
- Utility gas (14%)
- Fuel oil, kerosene, etc. (8%)
- Electricity (3%)
96.2% of residents of Bucephalia township speak English at home.
2.4% of residents speak Spanish at home (73% speak English very well, 19% speak English well, 8% speak English not well).
1.4% of residents speak other Indo-European language at home (87% speak English very well, 13% speak English well).
Household type by relationship:
Households: 1,146- In family households: 916 (256 male householders, 68 female householders)
280 spouses, 257 children (246 natural, 6 adopted, 5 stepchildren), 13 grandchildren, 5 brothers or sisters, 3 parents, 14 other relatives, 20 non-relatives
- In nonfamily households: 230 (113 male householders (79 living alone)), 67 female householders (60 living alone)), 50 nonrelatives
Size of family households: 171 2-persons, 72 3-persons, 53 4-persons, 19 5-persons, 7 6-persons, 2 7-or-more-persons,
Size of nonfamily households: 139 1-person, 31 2-persons, 4 3-persons, 4 4-persons, 2 5-persons,
13 married couples with children.
0 single-parent households (0 men, 0 women).
Private vs. public school enrollment:
Students in private schools in grades 1 to 8 (elementary and middle school): 0
| Here: | 0.0% |
| North Dakota: | 7.1% |
Students in private schools in grades 9 to 12 (high school): 0
| Here: | 0.0% |
| North Dakota: | 6.0% |
Students in private undergraduate colleges: 4
| Here: | 13.3% |
| North Dakota: | 10.5% |