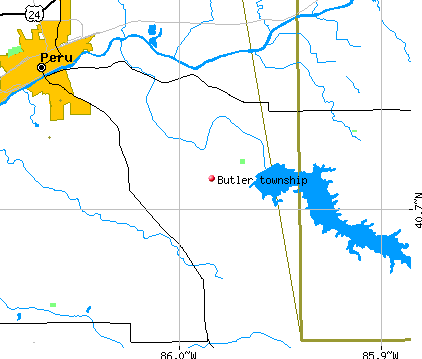
Butler township, Miami County, Indiana (IN) detailed profile
Number of foreign born residents: 0 (100% naturalized citizens)
| Butler township: | 0.4% |
| Whole state: | 3.1% |
52% of Butler township residents lived in the same house 5 years ago.
Out of people who lived in different houses, 56% lived in this county.
Out of people who lived in different counties, 46% lived in Indiana.
Place of birth for U.S.-born residents:
- This state: 1278
- Northeast: 17
- Midwest: 171
- South: 310
- West: 196
Median price asked for vacant for-sale houses in 2000: $33,800
Percentage of households with unmarried partners: 6.6%
No gay or lesbian households reported
Housing units in structures:
- One, detached: 512
- Mobile homes: 256
- Boats, RVs, vans, etc.: 15
Median worth of mobile homes: $43,000
Housing units in Butler township with a mortgage: 117 (0 second mortgage, 6 home equity loan, 0 both second mortgage and home equity loan)
Houses without a mortgage: 105
- Construction (19%)
- Transportation equipment (17%)
- Agriculture, forestry, fishing and hunting (12%)
- Accommodation and food services (8%)
- Metal and metal products (6%)
- Electrical equipment, appliances, and components (5%)
- Recyclable material merchant wholesalers (4%)
- Health care (26%)
- Educational services (14%)
- Finance and insurance (9%)
- Printing and related support activities (9%)
- Computer and electronic products (7%)
- Department and other general merchandise stores (5%)
- Transportation equipment (4%)
- Metal workers and plastic workers (14%)
- Agricultural workers including supervisors (9%)
- Other management occupations except farmers and farm managers (8%)
- Laborers and material movers, hand (8%)
- Carpenters (6%)
- Cooks and food preparation workers (6%)
- Vehicle and mobile equipment mechanics, installers, and repairers (6%)
- Sales representatives, services, wholesale and manufacturing (15%)
- Other management occupations except farmers and farm managers (9%)
- Financial clerks except bookkeeping, accounting, and auditing clerks (9%)
- Cashiers (7%)
- Preschool, kindergarten, elementary and middle school teachers (6%)
- Secretaries and administrative assistants (6%)
- Retail sales workers except cashiers (5%)
Most common first ancestries reported in Butler township:
- United States or American (29.7%)
- German (16.3%)
- Irish (14.1%)
- English (6.4%)
- Dutch (3.6%)
- Italian (2.6%)
- Norwegian (1.6%)
Most common places of birth for the foreign-born residents:
- Germany (67%)
Means of transportation to work:
- Drove a car alone: 761 (77%)
- Carpooled: 135 (14%)
- Walked: 6 (1%)
- Other means: 14 (1%)
- Worked at home: 66 (7%)
Most commonly used house heating fuel:
- Bottled, tank, or LP gas (49%)
- Electricity (27%)
- Wood (20%)
- Utility gas (4%)
95.7% of residents of Butler township speak English at home.
1.6% of residents speak Spanish at home (57% speak English very well, 17% speak English well, 27% speak English not well).
0.7% of residents speak other Indo-European language at home (46% speak English very well, 54% speak English well).
0.9% of residents speak Asian or Pacific Island language at home (100% speak English very well).
1.0% of residents speak other language at home (100% speak English very well).
Household type by relationship:
Households: 1,992- In family households: 1,811 (518 male householders, 66 female householders)
507 spouses, 604 children (540 natural, 9 adopted, 55 stepchildren), 24 grandchildren, 9 brothers or sisters, 18 parents, 17 other relatives, 48 non-relatives
- In nonfamily households: 181 (85 male householders (75 living alone)), 65 female householders (53 living alone)), 31 nonrelatives
Size of family households: 245 2-persons, 124 3-persons, 128 4-persons, 56 5-persons, 29 6-persons, 2 7-or-more-persons,
Size of nonfamily households: 128 1-person, 15 2-persons, 7 3-persons,
157 married couples with children.
30 single-parent households (16 men, 14 women).
Private vs. public school enrollment:
Students in private schools in grades 1 to 8 (elementary and middle school): 16
| Here: | 7.8% |
| Indiana: | 11.8% |
Students in private schools in grades 9 to 12 (high school): 0
| Here: | 0.0% |
| Indiana: | 8.8% |
Students in private undergraduate colleges: 2
| Here: | 3.3% |
| Indiana: | 23.4% |