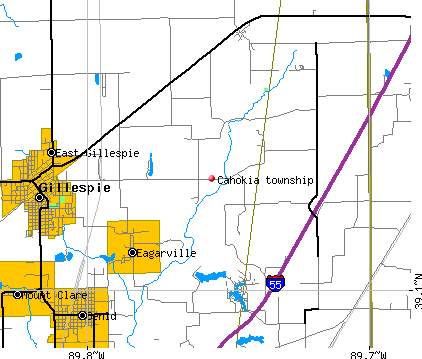
Cahokia township, Macoupin County, Illinois (IL) detailed profile
Number of foreign born residents: 0 (100% naturalized citizens)
| Cahokia township: | 0.3% |
| Whole state: | 12.3% |
67% of Cahokia township residents lived in the same house 5 years ago.
Out of people who lived in different houses, 60% lived in this county.
Out of people who lived in different counties, 79% lived in Illinois.
Place of birth for U.S.-born residents:
- This state: 2819
- Northeast: 15
- Midwest: 319
- South: 160
- West: 59
Median price asked for vacant for-sale houses in 2000: $31,700
Percentage of households with unmarried partners: 6.2%
Likely homosexual households (counted as self-reported same-sex unmarried-partner households)
- Lesbian couples: 0.1% of all households
- Gay men: 0.2% of all households
Housing units in structures:
- One, detached: 1,343
- One, attached: 2
- Two: 36
- 3 or 4: 24
- 5 to 9: 4
- 10 to 19: 3
- Mobile homes: 158
Median worth of mobile homes: $28,800
Housing units in Cahokia township with a mortgage: 439 (29 second mortgage, 57 home equity loan, 0 both second mortgage and home equity loan)
Houses without a mortgage: 447
- Construction (12%)
- Metal and metal products (9%)
- Agriculture, forestry, fishing and hunting (7%)
- Truck transportation (6%)
- Public administration (5%)
- Mining, quarrying, and oil and gas extraction (5%)
- Administrative and support and waste management services (5%)
- Health care (26%)
- Educational services (11%)
- Finance and insurance (9%)
- Department and other general merchandise stores (6%)
- Accommodation and food services (5%)
- Food and beverage stores (5%)
- Public administration (4%)
- Driver/sales workers and truck drivers (9%)
- Other production occupations including supervisors (7%)
- Laborers and material movers, hand (6%)
- Metal workers and plastic workers (5%)
- Other management occupations except farmers and farm managers (5%)
- Building and grounds cleaning and maintenance occupations (5%)
- Other sales and related workers including supervisors (5%)
- Secretaries and administrative assistants (9%)
- Registered nurses (7%)
- Other sales and related workers including supervisors (7%)
- Nursing, psychiatric, and home health aides (5%)
- Preschool, kindergarten, elementary and middle school teachers (4%)
- Cashiers (4%)
- Retail sales workers except cashiers (4%)
Most common first ancestries reported in Cahokia township:
- German (31.2%)
- Italian (16.1%)
- United States or American (14.7%)
- Irish (11.9%)
- English (6.0%)
- French (except Basque) (2.1%)
- Slovak (1.9%)
Most common places of birth for the foreign-born residents:
- Italy (56%)
- United Kingdom (22%)
- Germany (22%)
Means of transportation to work:
- Drove a car alone: 1,126 (78%)
- Carpooled: 208 (14%)
- Bus or trolley bus: 6 (0%)
- Bicycle: 4 (0%)
- Walked: 7 (0%)
- Other means: 12 (1%)
- Worked at home: 81 (6%)
Most commonly used house heating fuel:
- Utility gas (68%)
- Bottled, tank, or LP gas (18%)
- Electricity (9%)
- Fuel oil, kerosene, etc. (3%)
- Wood (2%)
97.6% of residents of Cahokia township speak English at home.
0.6% of residents speak Spanish at home (80% speak English very well, 20% speak English not well).
1.5% of residents speak other Indo-European language at home (82% speak English very well, 6% speak English well, 12% speak English not well).
0.3% of residents speak other language at home (100% speak English very well).
Household type by relationship:
Households: 3,392- In family households: 2,763 (743 male householders, 167 female householders)
749 spouses, 944 children (801 natural, 18 adopted, 125 stepchildren), 31 grandchildren, 24 brothers or sisters, 12 parents, 32 other relatives, 61 non-relatives
- In nonfamily households: 629 (265 male householders (198 living alone)), 238 female householders (229 living alone)), 126 nonrelatives
Size of family households: 438 2-persons, 184 3-persons, 177 4-persons, 80 5-persons, 21 6-persons, 10 7-or-more-persons,
Size of nonfamily households: 427 1-person, 50 2-persons, 18 3-persons, 8 6-persons,
554 married couples with children.
177 single-parent households (47 men, 130 women).
Private vs. public school enrollment:
Students in private schools in grades 1 to 8 (elementary and middle school): 7
| Here: | 1.8% |
| Illinois: | 13.4% |
Students in private schools in grades 9 to 12 (high school): 11
| Here: | 6.6% |
| Illinois: | 11.1% |
Students in private undergraduate colleges: 17
| Here: | 20.2% |
| Illinois: | 25.8% |