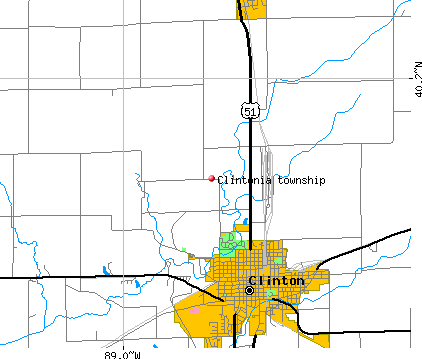
Clintonia township, De Witt County, Illinois (IL) detailed profile
Number of foreign born residents: 2 (47% naturalized citizens)
| Clintonia township: | 1.8% |
| Whole state: | 12.3% |
58% of Clintonia township residents lived in the same house 5 years ago.
Out of people who lived in different houses, 63% lived in this county.
Out of people who lived in different counties, 70% lived in Illinois.
Place of birth for U.S.-born residents:
- This state: 6256
- Northeast: 157
- Midwest: 625
- South: 455
- West: 137
Median price asked for vacant for-sale houses in 2000: $49,200
Percentage of households with unmarried partners: 5.7%
Likely homosexual households (counted as self-reported same-sex unmarried-partner households)
- Lesbian couples: 0.1% of all households
- Gay men: 0.2% of all households
People in group quarters in Clintonia township, Illinois:
- 70 people in nursing homes
- 54 people in local jails and other confinement facilities (including police lockups)
- 15 people in homes or halfway houses for drug/alcohol abuse
- 12 people in homes for the physically handicapped
- 2 people in schools, hospitals, or wards for the mentally retarded

Housing units in structures:
- One, detached: 2,563
- One, attached: 24
- Two: 177
- 3 or 4: 288
- 5 to 9: 136
- 10 to 19: 38
- 20 to 49: 90
- 50 or more: 71
- Mobile homes: 144
Median worth of mobile homes: $10,200
Housing units in Clintonia township with a mortgage: 1,288 (151 second mortgage, 63 home equity loan, 7 both second mortgage and home equity loan)
Houses without a mortgage: 707
- Construction (11%)
- Transportation equipment (8%)
- Truck transportation (5%)
- Printing and related support activities (5%)
- Finance and insurance (5%)
- Utilities (5%)
- Metal and metal products (4%)
- Health care (18%)
- Finance and insurance (16%)
- Educational services (8%)
- Accommodation and food services (6%)
- Department and other general merchandise stores (5%)
- Administrative and support and waste management services (4%)
- Food and beverage stores (3%)
- Metal workers and plastic workers (8%)
- Driver/sales workers and truck drivers (8%)
- Other production occupations including supervisors (7%)
- Electrical equipment mechanics and other installation, maintenance, and repair occupations including supervisors (6%)
- Building and grounds cleaning and maintenance occupations (5%)
- Retail sales workers except cashiers (4%)
- Material recording, scheduling, dispatching, and distributing workers (3%)
- Secretaries and administrative assistants (10%)
- Other office and administrative support workers including supervisors (9%)
- Other management occupations except farmers and farm managers (5%)
- Material recording, scheduling, dispatching, and distributing workers (4%)
- Other production occupations including supervisors (4%)
- Cashiers (4%)
- Information and record clerks except customer service representatives (4%)
Most common first ancestries reported in Clintonia township:
- German (21.9%)
- United States or American (19.1%)
- English (17.0%)
- Irish (13.0%)
- Dutch (2.9%)
- Italian (2.7%)
- French (except Basque) (2.6%)
Most common places of birth for the foreign-born residents:
- Mexico (45%)
- China, excluding Hong Kong and Taiwan (8%)
- Yugoslavia (7%)
- Other Eastern Europe (6%)
- Philippines (6%)
- Other South Eastern Asia (6%)
- United Kingdom (5%)
Means of transportation to work:
- Drove a car alone: 2,986 (80%)
- Carpooled: 537 (14%)
- Bus or trolley bus: 7 (0%)
- Walked: 142 (4%)
- Other means: 4 (0%)
- Worked at home: 62 (2%)
Most commonly used house heating fuel:
- Utility gas (82%)
- Electricity (15%)
- Bottled, tank, or LP gas (2%)
People in group quarters in Clintonia township, Illinois:
- 70 people in nursing homes
- 54 people in local jails and other confinement facilities (including police lockups)
- 15 people in homes or halfway houses for drug/alcohol abuse
- 12 people in homes for the physically handicapped
- 2 people in schools, hospitals, or wards for the mentally retarded
97.5% of residents of Clintonia township speak English at home.
1.5% of residents speak Spanish at home (36% speak English very well, 28% speak English well, 19% speak English not well, 17% don't speak English at all).
0.6% of residents speak other Indo-European language at home (71% speak English very well, 29% speak English well).
0.3% of residents speak Asian or Pacific Island language at home (100% speak English very well).
0.1% of residents speak other language at home (100% speak English very well).
Household type by relationship:
Households: 7,651- In family households: 6,340 (1,651 male householders, 439 female householders)
1,672 spouses, 2,219 children (1,917 natural, 37 adopted, 265 stepchildren), 124 grandchildren, 22 brothers or sisters, 13 parents, 53 other relatives, 147 non-relatives
- In nonfamily households: 1,311 (478 male householders (403 living alone)), 674 female householders (636 living alone)), 159 nonrelatives
- In group quarters: 154 (126 institutionalized population)
Size of family households: 947 2-persons, 490 3-persons, 389 4-persons, 173 5-persons, 86 6-persons, 5 7-or-more-persons,
Size of nonfamily households: 1,039 1-person, 95 2-persons, 8 3-persons, 4 4-persons, 2 6-persons, 4 7-or-more-persons,
1,259 married couples with children.
504 single-parent households (115 men, 389 women).
Private vs. public school enrollment:
Students in private schools in grades 1 to 8 (elementary and middle school): 38
| Here: | 4.1% |
| Illinois: | 13.4% |
Students in private schools in grades 9 to 12 (high school): 28
| Here: | 6.1% |
| Illinois: | 11.1% |
Students in private undergraduate colleges: 13
| Here: | 5.4% |
| Illinois: | 25.8% |