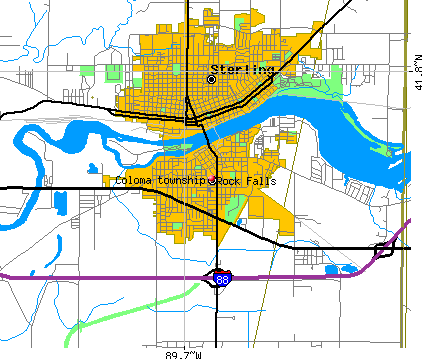
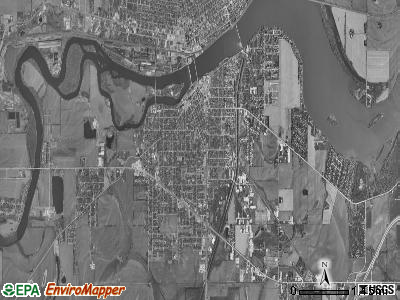
Coloma township, Whiteside County, Illinois (IL) detailed profile
Number of foreign born residents: 3 (40% naturalized citizens)
| Coloma township: | 2.9% |
| Whole state: | 12.3% |
59% of Coloma township residents lived in the same house 5 years ago.
Out of people who lived in different houses, 74% lived in this county.
Out of people who lived in different counties, 53% lived in Illinois.
Place of birth for U.S.-born residents:
- This state: 9408
- Northeast: 99
- Midwest: 1025
- South: 689
- West: 188
Median price asked for vacant for-sale houses in 2000: $64,400
Percentage of households with unmarried partners: 6.4%
Likely homosexual households (counted as self-reported same-sex unmarried-partner households)
- Lesbian couples: 0.2% of all households
- Gay men: 0.2% of all households
People in group quarters in Coloma township, Illinois:
- 81 people in nursing homes
- 24 people in other noninstitutional group quarters
- 14 people in homes for the mentally retarded
Housing units in structures:
- One, detached: 3,930
- One, attached: 42
- Two: 112
- 3 or 4: 313
- 5 to 9: 186
- 10 to 19: 71
- 20 to 49: 99
- 50 or more: 133
- Mobile homes: 223
Median worth of mobile homes: $20,200
Housing units in Coloma township with a mortgage: 1,844 (192 second mortgage, 231 home equity loan, 17 both second mortgage and home equity loan)
Houses without a mortgage: 1,210
- Metal and metal products (25%)
- Construction (8%)
- Accommodation and food services (5%)
- Truck transportation (4%)
- Machinery (4%)
- Food (4%)
- Repair and maintenance (3%)
- Health care (19%)
- Metal and metal products (13%)
- Accommodation and food services (9%)
- Educational services (7%)
- Department and other general merchandise stores (4%)
- Finance and insurance (4%)
- Professional, scientific, and technical services (4%)
- Metal workers and plastic workers (11%)
- Other production occupations including supervisors (8%)
- Driver/sales workers and truck drivers (7%)
- Laborers and material movers, hand (7%)
- Electrical equipment mechanics and other installation, maintenance, and repair occupations including supervisors (5%)
- Building and grounds cleaning and maintenance occupations (4%)
- Material recording, scheduling, dispatching, and distributing workers (4%)
- Other production occupations including supervisors (7%)
- Nursing, psychiatric, and home health aides (6%)
- Assemblers and fabricators (5%)
- Secretaries and administrative assistants (4%)
- Other sales and related workers including supervisors (4%)
- Health technologists and technicians (4%)
- Information and record clerks except customer service representatives (4%)
Most common first ancestries reported in Coloma township:
- German (29.6%)
- Irish (11.6%)
- United States or American (11.4%)
- English (7.6%)
- Italian (4.6%)
- Dutch (3.0%)
- Swedish (2.2%)
Most common places of birth for the foreign-born residents:
- Mexico (59%)
- Other Eastern Europe (11%)
- Jamaica (5%)
- Japan (3%)
- Philippines (3%)
- Canada (3%)
- El Salvador (2%)
Means of transportation to work:
- Drove a car alone: 4,271 (80%)
- Carpooled: 682 (13%)
- Bus or trolley bus: 22 (0%)
- Motorcycle: 10 (0%)
- Bicycle: 29 (1%)
- Walked: 167 (3%)
- Other means: 47 (1%)
- Worked at home: 96 (2%)
Most commonly used house heating fuel:
- Utility gas (88%)
- Electricity (11%)
- Bottled, tank, or LP gas (1%)
- Other fuel (1%)
People in group quarters in Coloma township, Illinois:
- 81 people in nursing homes
- 24 people in other noninstitutional group quarters
- 14 people in homes for the mentally retarded
92.4% of residents of Coloma township speak English at home.
6.0% of residents speak Spanish at home (66% speak English very well, 19% speak English well, 15% speak English not well).
1.2% of residents speak other Indo-European language at home (57% speak English very well, 36% speak English well, 7% don't speak English at all).
0.2% of residents speak Asian or Pacific Island language at home (68% speak English very well, 32% speak English well).
0.1% of residents speak other language at home (64% speak English very well, 36% speak English well).
Household type by relationship:
Households: 11,686- In family households: 9,695 (2,456 male householders, 760 female householders)
2,385 spouses, 3,258 children (2,879 natural, 93 adopted, 286 stepchildren), 296 grandchildren, 51 brothers or sisters, 82 parents, 105 other relatives, 302 non-relatives
- In nonfamily households: 1,991 (662 male householders (522 living alone)), 985 female householders (855 living alone)), 344 nonrelatives
- In group quarters: 119 (81 institutionalized population)
Size of family households: 1,486 2-persons, 750 3-persons, 598 4-persons, 255 5-persons, 94 6-persons, 33 7-or-more-persons,
Size of nonfamily households: 1,377 1-person, 203 2-persons, 56 3-persons, 9 4-persons, 2 5-persons,
1,686 married couples with children.
851 single-parent households (190 men, 661 women).
Private vs. public school enrollment:
Students in private schools in grades 1 to 8 (elementary and middle school): 84
| Here: | 6.1% |
| Illinois: | 13.4% |
Students in private schools in grades 9 to 12 (high school): 47
| Here: | 8.2% |
| Illinois: | 11.1% |
Students in private undergraduate colleges: 34
| Here: | 10.4% |
| Illinois: | 25.8% |