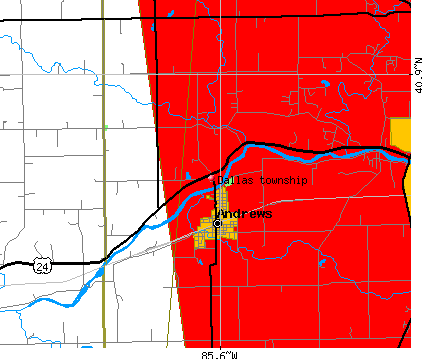
Dallas township, Huntington County, Indiana (IN) detailed profile
Number of foreign born residents: 1 (79% naturalized citizens)
| Dallas township: | 0.6% |
| Whole state: | 3.1% |
67% of Dallas township residents lived in the same house 5 years ago.
Out of people who lived in different houses, 63% lived in this county.
Out of people who lived in different counties, 77% lived in Indiana.
Place of birth for U.S.-born residents:
- This state: 1704
- Northeast: 48
- Midwest: 272
- South: 185
- West: 34
Median price asked for vacant for-sale houses in 2000: $55,000
Percentage of households with unmarried partners: 6.5%
Likely homosexual households (counted as self-reported same-sex unmarried-partner households)
- Lesbian couples: 0.2% of all households
- Gay men: 0.5% of all households
Housing units in structures:
- One, detached: 741
- One, attached: 2
- Two: 16
- 3 or 4: 28
- 5 to 9: 5
- Mobile homes: 104
Median worth of mobile homes: $16,900
Housing units in Dallas township with a mortgage: 411 (54 second mortgage, 68 home equity loan, 0 both second mortgage and home equity loan)
Houses without a mortgage: 94
- Transportation equipment (16%)
- Metal and metal products (15%)
- Construction (6%)
- Accommodation and food services (5%)
- Food (5%)
- Miscellaneous manufacturing (3%)
- Repair and maintenance (3%)
- Health care (19%)
- Transportation equipment (14%)
- Social assistance (7%)
- Finance and insurance (6%)
- Educational services (5%)
- Metal and metal products (5%)
- Accommodation and food services (4%)
- Metal workers and plastic workers (14%)
- Other production occupations including supervisors (12%)
- Electrical equipment mechanics and other installation, maintenance, and repair occupations including supervisors (9%)
- Driver/sales workers and truck drivers (6%)
- Vehicle and mobile equipment mechanics, installers, and repairers (5%)
- Assemblers and fabricators (5%)
- Laborers and material movers, hand (4%)
- Other production occupations including supervisors (11%)
- Metal workers and plastic workers (8%)
- Other office and administrative support workers including supervisors (6%)
- Child care workers (5%)
- Assemblers and fabricators (5%)
- Health technologists and technicians (5%)
- Material recording, scheduling, dispatching, and distributing workers (4%)
Most common first ancestries reported in Dallas township:
- German (32.7%)
- United States or American (24.2%)
- English (10.9%)
- Irish (6.9%)
- Dutch (3.8%)
- French (except Basque) (3.8%)
- Polish (1.8%)
Most common places of birth for the foreign-born residents:
- Germany (36%)
- Mexico (29%)
- Canada (21%)
- Spain (14%)
Means of transportation to work:
- Drove a car alone: 885 (77%)
- Carpooled: 189 (17%)
- Motorcycle: 4 (0%)
- Walked: 21 (2%)
- Other means: 9 (1%)
- Worked at home: 35 (3%)
Most commonly used house heating fuel:
- Utility gas (40%)
- Electricity (32%)
- Bottled, tank, or LP gas (16%)
- Fuel oil, kerosene, etc. (9%)
- Wood (3%)
- Other fuel (1%)
96.3% of residents of Dallas township speak English at home.
1.2% of residents speak Spanish at home (85% speak English very well, 8% speak English well, 8% speak English not well).
1.5% of residents speak other Indo-European language at home (91% speak English very well, 9% speak English well).
0.8% of residents speak Asian or Pacific Island language at home (100% speak English very well).
0.2% of residents speak other language at home (100% speak English very well).
Household type by relationship:
Households: 2,275- In family households: 2,068 (568 male householders, 118 female householders)
518 spouses, 750 children (672 natural, 21 adopted, 57 stepchildren), 47 grandchildren, 3 brothers or sisters, 17 parents, 11 other relatives, 36 non-relatives
- In nonfamily households: 207 (71 male householders (53 living alone)), 95 female householders (79 living alone)), 41 nonrelatives
Size of family households: 273 2-persons, 168 3-persons, 147 4-persons, 64 5-persons, 29 6-persons, 5 7-or-more-persons,
Size of nonfamily households: 132 1-person, 29 2-persons, 3 3-persons, 2 5-persons,
443 married couples with children.
137 single-parent households (43 men, 94 women).
Private vs. public school enrollment:
Students in private schools in grades 1 to 8 (elementary and middle school): 9
| Here: | 2.9% |
| Indiana: | 11.8% |
Students in private schools in grades 9 to 12 (high school): 0
| Here: | 0.0% |
| Indiana: | 8.8% |
Students in private undergraduate colleges: 24
| Here: | 37.5% |
| Indiana: | 23.4% |