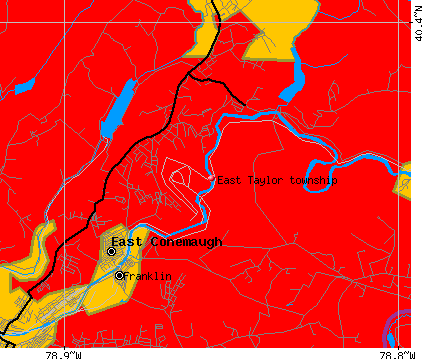
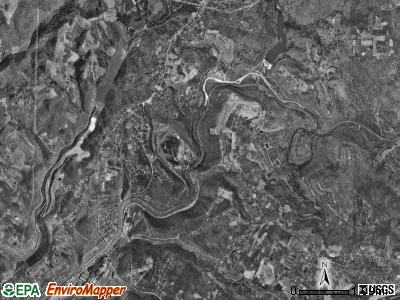
East Taylor township, Cambria County, Pennsylvania (PA) detailed profile
Number of foreign born residents: 2 (53% naturalized citizens)
| East Taylor township: | 1.9% |
| Whole state: | 4.1% |
81% of East Taylor township residents lived in the same house 5 years ago.
Out of people who lived in different houses, 80% lived in this county.
Out of people who lived in different counties, 71% lived in Pennsylvania.
Place of birth for U.S.-born residents:
- This state: 2518
- Northeast: 33
- Midwest: 19
- South: 58
- West: 26
Median price asked for vacant for-sale houses in 2000: $37,500
Percentage of households with unmarried partners: 4.4%
Likely homosexual households (counted as self-reported same-sex unmarried-partner households)
- Lesbian couples: 0.3% of all households
- Gay men: 0.1% of all households
Housing units in structures:
- One, detached: 967
- One, attached: 19
- Two: 27
- 5 to 9: 4
- Mobile homes: 105
- Boats, RVs, vans, etc.: 4
Median worth of mobile homes: $10,600
Housing units in East Taylor township with a mortgage: 417 (36 second mortgage, 54 home equity loan, 10 both second mortgage and home equity loan)
Houses without a mortgage: 466
- Construction (12%)
- Metal and metal products (10%)
- Educational services (6%)
- Truck transportation (6%)
- Professional, scientific, and technical services (5%)
- Health care (5%)
- Public administration (4%)
- Health care (26%)
- Finance and insurance (9%)
- Educational services (7%)
- Accommodation and food services (7%)
- Public administration (6%)
- Professional, scientific, and technical services (4%)
- Apparel (4%)
- Driver/sales workers and truck drivers (12%)
- Laborers and material movers, hand (6%)
- Metal workers and plastic workers (5%)
- Vehicle and mobile equipment mechanics, installers, and repairers (5%)
- Electrical equipment mechanics and other installation, maintenance, and repair occupations including supervisors (4%)
- Material recording, scheduling, dispatching, and distributing workers (4%)
- Computer specialists (4%)
- Registered nurses (7%)
- Other office and administrative support workers including supervisors (6%)
- Secretaries and administrative assistants (6%)
- Health technologists and technicians (6%)
- Other production occupations including supervisors (5%)
- Cashiers (4%)
- Other financial specialists (4%)
Most common first ancestries reported in East Taylor township:
- German (29.4%)
- Polish (13.1%)
- Italian (7.3%)
- English (6.6%)
- Slovak (6.5%)
- Irish (5.5%)
- United States or American (4.4%)
Most common places of birth for the foreign-born residents:
- China, excluding Hong Kong and Taiwan (38%)
- Korea (26%)
- Italy (19%)
- Poland (9%)
- Germany (8%)
Means of transportation to work:
- Drove a car alone: 984 (85%)
- Carpooled: 125 (11%)
- Bus or trolley bus: 5 (0%)
- Taxi: 5 (0%)
- Walked: 15 (1%)
- Other means: 14 (1%)
- Worked at home: 12 (1%)
Most commonly used house heating fuel:
- Fuel oil, kerosene, etc. (67%)
- Utility gas (16%)
- Electricity (8%)
- Coal or coke (8%)
96.5% of residents of East Taylor township speak English at home.
0.8% of residents speak Spanish at home (100% speak English very well).
1.5% of residents speak other Indo-European language at home (74% speak English very well, 26% speak English well).
1.2% of residents speak Asian or Pacific Island language at home (43% speak English well, 57% speak English not well).
Household type by relationship:
Households: 2,726- In family households: 2,428 (683 male householders, 144 female householders)
631 spouses, 811 children (756 natural, 23 adopted, 32 stepchildren), 30 grandchildren, 18 brothers or sisters, 39 parents, 51 other relatives, 21 non-relatives
- In nonfamily households: 298 (130 male householders (108 living alone)), 136 female householders (136 living alone)), 32 nonrelatives
Size of family households: 369 2-persons, 214 3-persons, 167 4-persons, 57 5-persons, 9 6-persons, 11 7-or-more-persons,
Size of nonfamily households: 244 1-person, 17 2-persons, 5 3-persons,
412 married couples with children.
96 single-parent households (26 men, 70 women).
Private vs. public school enrollment:
Students in private schools in grades 1 to 8 (elementary and middle school): 61
| Here: | 22.9% |
| Pennsylvania: | 16.0% |
Students in private schools in grades 9 to 12 (high school): 16
| Here: | 11.2% |
| Pennsylvania: | 13.1% |
Students in private undergraduate colleges: 11
| Here: | 18.6% |
| Pennsylvania: | 37.3% |