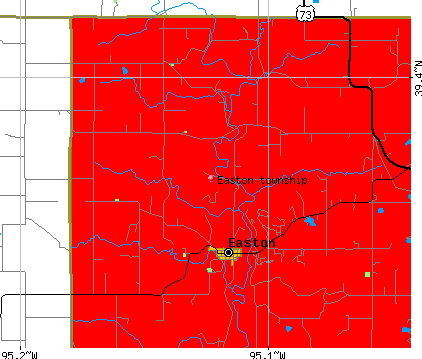
Easton township, Leavenworth County, Kansas (KS) detailed profile
Number of foreign born residents: 0 (20% naturalized citizens)
| Easton township: | 0.4% |
| Whole state: | 5.0% |
56% of Easton township residents lived in the same house 5 years ago.
Out of people who lived in different houses, 72% lived in this county.
Out of people who lived in different counties, 54% lived in Kansas.
Place of birth for U.S.-born residents:
- This state: 783
- Northeast: 32
- Midwest: 196
- South: 120
- West: 80
Percentage of households with unmarried partners: 4.3%
Likely homosexual households (counted as self-reported same-sex unmarried-partner households)
- Lesbian couples: 0.2% of all households
- Gay men: 0.0% of all households
50 people in nursing homes
Housing units in structures:
- One, detached: 359
- One, attached: 2
- Two: 3
- 5 to 9: 11
- Mobile homes: 107
Median worth of mobile homes: $18,500
Housing units in Easton township with a mortgage: 98 (8 second mortgage, 4 home equity loan, 4 both second mortgage and home equity loan)
Houses without a mortgage: 45
- Construction (24%)
- Public administration (19%)
- Agriculture, forestry, fishing and hunting (13%)
- Educational services (8%)
- Health care (4%)
- Publishing, and motion picture and sound recording industries (4%)
- Administrative and support and waste management services (3%)
- Public administration (17%)
- Health care (14%)
- Educational services (12%)
- Accommodation and food services (8%)
- Agriculture, forestry, fishing and hunting (8%)
- Social assistance (7%)
- Professional, scientific, and technical services (6%)
- Farmers and farm managers (10%)
- Electrical equipment mechanics and other installation, maintenance, and repair occupations including supervisors (8%)
- Law enforcement workers including supervisors (6%)
- Construction laborers (6%)
- Supervisors and other personal care and service workers except personal appearance, transportation, and child care workers (5%)
- Other management occupations except farmers and farm managers (5%)
- Preschool, kindergarten, elementary and middle school teachers (5%)
- Other office and administrative support workers including supervisors (7%)
- Mathematical science occupations (5%)
- Other teachers and instructors, education, training, and library occupations (5%)
- Waiters and waitresses (5%)
- Material recording, scheduling, dispatching, and distributing workers (5%)
- Secretaries and administrative assistants (5%)
- Business operations specialists (4%)
Most common first ancestries reported in Easton township:
- German (35.3%)
- Irish (19.4%)
- United States or American (13.4%)
- English (9.2%)
- Dutch (3.3%)
- Scotch-Irish (2.2%)
- Scottish (1.7%)
Most common places of birth for the foreign-born residents:
- Panama (80%)
Means of transportation to work:
- Drove a car alone: 415 (67%)
- Carpooled: 99 (16%)
- Walked: 28 (5%)
- Other means: 12 (2%)
- Worked at home: 65 (11%)
Most commonly used house heating fuel:
- Bottled, tank, or LP gas (44%)
- Utility gas (31%)
- Wood (12%)
- Electricity (12%)
- Other fuel (1%)
50 people in nursing homes
96.0% of residents of Easton township speak English at home.
2.2% of residents speak Spanish at home (48% speak English very well, 48% speak English well, 4% speak English not well).
1.8% of residents speak other Indo-European language at home (76% speak English very well, 24% speak English well).
Household type by relationship:
Households: 1,178- In family households: 1,086 (314 male householders, 41 female householders)
297 spouses, 330 children (275 natural, 7 adopted, 48 stepchildren), 20 grandchildren, 3 brothers or sisters, 8 parents, 8 other relatives, 65 non-relatives
- In nonfamily households: 92 (42 male householders (42 living alone)), 43 female householders (31 living alone)), 7 nonrelatives
- In group quarters: 49 (all institutionalized)
Size of family households: 169 2-persons, 72 3-persons, 72 4-persons, 11 5-persons, 22 6-persons, 9 7-or-more-persons,
Size of nonfamily households: 73 1-person, 12 2-persons,
259 married couples with children.
61 single-parent households (21 men, 40 women).
Private vs. public school enrollment:
Students in private schools in grades 1 to 8 (elementary and middle school): 4
| Here: | 2.7% |
| Kansas: | 11.1% |
Students in private schools in grades 9 to 12 (high school): 0
| Here: | 0.0% |
| Kansas: | 7.9% |
Students in private undergraduate colleges: 8
| Here: | 21.1% |
| Kansas: | 13.8% |