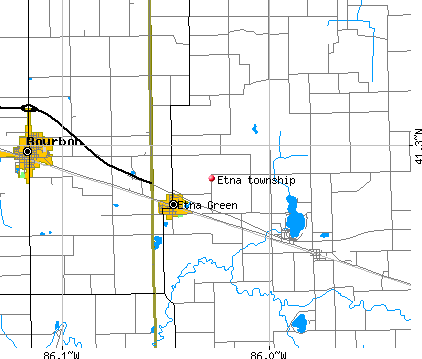
Etna township, Kosciusko County, Indiana (IN) detailed profile
Number of foreign born residents: 2 (0% naturalized citizens)
| Etna township: | 1.6% |
| Whole state: | 3.1% |
64% of Etna township residents lived in the same house 5 years ago.
Out of people who lived in different houses, 49% lived in this county.
Out of people who lived in different counties, 79% lived in Indiana.
Place of birth for U.S.-born residents:
- This state: 1285
- Northeast: 35
- Midwest: 88
- South: 41
- West: 32
Median price asked for vacant for-sale houses in 2000: $55,000
Percentage of households with unmarried partners: 5.8%
Likely homosexual households (counted as self-reported same-sex unmarried-partner households)
- Lesbian couples: 0.4% of all households
- Gay men: 0.4% of all households
7 people in homes for the mentally retarded
Housing units in structures:
- One, detached: 379
- One, attached: 8
- Two: 24
- 3 or 4: 4
- Mobile homes: 93
Median worth of mobile homes: $13,700
Housing units in Etna township with a mortgage: 165 (12 second mortgage, 37 home equity loan, 0 both second mortgage and home equity loan)
Houses without a mortgage: 77
- Transportation equipment (16%)
- Construction (10%)
- Plastics and rubber products (8%)
- Wood products (8%)
- Truck transportation (6%)
- Agriculture, forestry, fishing and hunting (6%)
- Miscellaneous manufacturing (6%)
- Food and beverage stores (7%)
- Transportation equipment (7%)
- Professional, scientific, and technical services (7%)
- Printing and related support activities (6%)
- Educational services (6%)
- Health care (6%)
- Accommodation and food services (5%)
- Other production occupations including supervisors (16%)
- Driver/sales workers and truck drivers (9%)
- Metal workers and plastic workers (7%)
- Vehicle and mobile equipment mechanics, installers, and repairers (7%)
- Material recording, scheduling, dispatching, and distributing workers (4%)
- Construction trades workers except carpenters, electricians, painters, plumbers, and construction laborers (4%)
- Carpenters (4%)
- Cashiers (9%)
- Material recording, scheduling, dispatching, and distributing workers (7%)
- Other production occupations including supervisors (7%)
- Textile, apparel, and furnishings workers (6%)
- Secretaries and administrative assistants (6%)
- Health technologists and technicians (4%)
- Laborers and material movers, hand (4%)
Most common first ancestries reported in Etna township:
- German (39.5%)
- United States or American (25.1%)
- Irish (9.6%)
- English (4.2%)
- Swedish (2.8%)
- Polish (2.7%)
- Swiss (1.9%)
Most common places of birth for the foreign-born residents:
- Mexico (100%)
Means of transportation to work:
- Drove a car alone: 406 (61%)
- Carpooled: 153 (23%)
- Taxi: 10 (1%)
- Walked: 9 (1%)
- Other means: 17 (3%)
- Worked at home: 72 (11%)
Most commonly used house heating fuel:
- Utility gas (52%)
- Bottled, tank, or LP gas (31%)
- Fuel oil, kerosene, etc. (8%)
- Wood (5%)
- Electricity (3%)
- Other fuel (1%)
7 people in homes for the mentally retarded
83.9% of residents of Etna township speak English at home.
2.5% of residents speak Spanish at home (6% speak English very well, 69% speak English not well, 26% don't speak English at all).
13.5% of residents speak other Indo-European language at home (74% speak English very well, 19% speak English well, 7% speak English not well).
Household type by relationship:
Households: 1,502- In family households: 1,378 (326 male householders, 57 female householders)
300 spouses, 642 children (572 natural, 16 adopted, 54 stepchildren), 6 grandchildren, 3 brothers or sisters, 5 parents, 19 other relatives, 20 non-relatives
- In nonfamily households: 124 (45 male householders (30 living alone)), 56 female householders (51 living alone)), 23 nonrelatives
- In group quarters: 6 (0 institutionalized population)
Size of family households: 116 2-persons, 92 3-persons, 75 4-persons, 60 5-persons, 13 6-persons, 27 7-or-more-persons,
Size of nonfamily households: 81 1-person, 17 2-persons, 3 3-persons,
461 married couples with children.
80 single-parent households (35 men, 45 women).
Private vs. public school enrollment:
Students in private schools in grades 1 to 8 (elementary and middle school): 85
| Here: | 31.4% |
| Indiana: | 11.8% |
Students in private schools in grades 9 to 12 (high school): 10
| Here: | 10.2% |
| Indiana: | 8.8% |
Students in private undergraduate colleges: 20
| Here: | 71.4% |
| Indiana: | 23.4% |