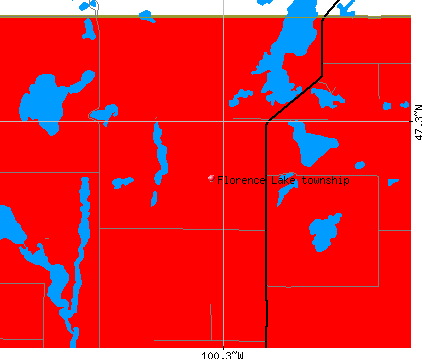
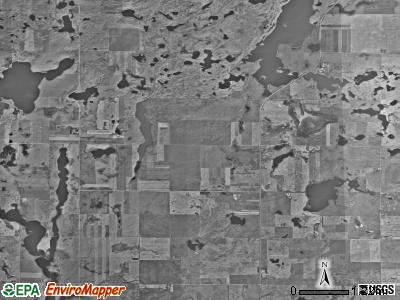
Florence Lake township, Burleigh County, North Dakota (ND) detailed profile
Number of foreign born residents: 107 (60% naturalized citizens)
| Florence Lake township: | 107.1% |
| Whole state: | 1.9% |
49% of Florence Lake township residents lived in the same house 5 years ago.
Out of people who lived in different houses, 48% lived in this county.
Out of people who lived in different counties, 77% lived in North Dakota.
Place of birth for U.S.-born residents:
- This state: 660
- Northeast: 24
- Midwest: 54
- South: 43
- West: 26
Median price asked for vacant for-sale houses in 2000: $100,000
Percentage of households with unmarried partners: 0.0%
No gay or lesbian households reported
Housing units in structures:
- One, detached: 388
- Two: 2
- Mobile homes: 165
- Boats, RVs, vans, etc.: 9
Median worth of mobile homes: $46,900
Housing units in Florence Lake township with a mortgage: 95 (8 second mortgage, 7 home equity loan, 0 both second mortgage and home equity loan)
Houses without a mortgage: 47
- Construction (10%)
- Transportation equipment (10%)
- Mining, quarrying, and oil and gas extraction (8%)
- Machinery (7%)
- Agriculture, forestry, fishing and hunting (6%)
- Metal and metal products (5%)
- Repair and maintenance (5%)
- Health care (10%)
- Educational services (9%)
- Public administration (8%)
- Accommodation and food services (6%)
- Food and beverage stores (6%)
- Metal and metal products (5%)
- Transportation equipment (5%)
- Metal workers and plastic workers (10%)
- Driver/sales workers and truck drivers (9%)
- Vehicle and mobile equipment mechanics, installers, and repairers (8%)
- Other management occupations except farmers and farm managers (6%)
- Construction laborers (5%)
- Electrical equipment mechanics and other installation, maintenance, and repair occupations including supervisors (5%)
- Other sales and related workers including supervisors (4%)
- Other sales and related workers including supervisors (8%)
- Other office and administrative support workers including supervisors (8%)
- Secretaries and administrative assistants (7%)
- Other management occupations except farmers and farm managers (6%)
- Cashiers (6%)
- Other production occupations including supervisors (6%)
- Information and record clerks except customer service representatives (5%)
Most common first ancestries reported in Florence Lake township:
- German (24.5%)
- Irish (10.0%)
- United States or American (10.0%)
- English (9.9%)
- Polish (6.4%)
- French (except Basque) (5.3%)
- Dutch (4.7%)
Most common places of birth for the foreign-born residents:
- Canada (47%)
- United Kingdom (27%)
- Germany (13%)
- Philippines (13%)
Means of transportation to work:
- Drove a car alone: 258 (75%)
- Carpooled: 47 (14%)
- Streetcar or trolley car: 2 (1%)
- Walked: 12 (3%)
- Worked at home: 25 (7%)
Most commonly used house heating fuel:
- Bottled, tank, or LP gas (56%)
- Utility gas (18%)
- Wood (15%)
- Fuel oil, kerosene, etc. (9%)
- Electricity (1%)
- Other fuel (1%)
99.0% of residents of Florence Lake township speak English at home.
0.3% of residents speak Spanish at home (100% speak English very well).
0.5% of residents speak other Indo-European language at home (100% speak English very well).
0.3% of residents speak Asian or Pacific Island language at home (100% speak English very well).
Household type by relationship:
Households: 816- In family households: 708 (188 male householders, 49 female householders)
197 spouses, 241 children (191 natural, 13 adopted, 37 stepchildren), 4 grandchildren, 0 brothers or sisters, 2 parents, 2 other relatives, 25 non-relatives
- In nonfamily households: 108 (45 male householders (31 living alone)), 37 female householders (30 living alone)), 26 nonrelatives
- In group quarters: 6 (0 institutionalized population)
Size of family households: 117 2-persons, 44 3-persons, 47 4-persons, 26 5-persons, 2 6-persons, 1 7-or-more-persons,
Size of nonfamily households: 61 1-person, 19 2-persons, 2 4-persons,
4 married couples with children.
0 single-parent households (0 men, 0 women).
Private vs. public school enrollment:
Students in private schools in grades 1 to 8 (elementary and middle school): 5
| Here: | 4.5% |
| North Dakota: | 7.1% |
Students in private schools in grades 9 to 12 (high school): 2
| Here: | 4.3% |
| North Dakota: | 6.0% |
Students in private undergraduate colleges: 6
| Here: | 28.6% |
| North Dakota: | 10.5% |