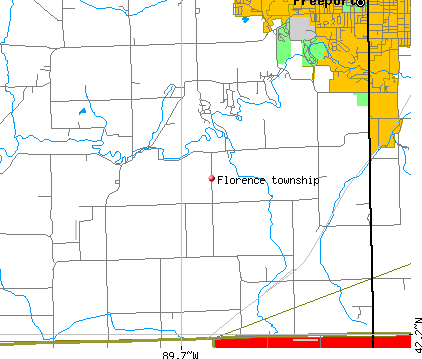
Florence township, Stephenson County, Illinois (IL) detailed profile
Number of foreign born residents: 1 (79% naturalized citizens)
| Florence township: | 1.1% |
| Whole state: | 12.3% |
68% of Florence township residents lived in the same house 5 years ago.
Out of people who lived in different houses, 57% lived in this county.
Out of people who lived in different counties, 77% lived in Illinois.
Place of birth for U.S.-born residents:
- This state: 1051
- Northeast: 10
- Midwest: 216
- South: 33
- West: 5
Median price asked for vacant for-sale houses in 2000: $162,500
Percentage of households with unmarried partners: 3.3%
Likely homosexual households (counted as self-reported same-sex unmarried-partner households)
- Lesbian couples: 0.0% of all households
- Gay men: 0.2% of all households

Housing units in structures:
- One, detached: 504
Housing units in Florence township with a mortgage: 244 (26 second mortgage, 35 home equity loan, 0 both second mortgage and home equity loan)
Houses without a mortgage: 145
- Construction (16%)
- Agriculture, forestry, fishing and hunting (9%)
- Health care (7%)
- Repair and maintenance (6%)
- Electrical equipment, appliances, and components (5%)
- Public administration (5%)
- Administrative and support and waste management services (5%)
- Health care (18%)
- Educational services (9%)
- Finance and insurance (8%)
- Food (8%)
- Accommodation and food services (7%)
- Electrical equipment, appliances, and components (4%)
- Professional, scientific, and technical services (4%)
- Other production occupations including supervisors (9%)
- Farmers and farm managers (8%)
- Construction trades workers except carpenters, electricians, painters, plumbers, and construction laborers (7%)
- Other sales and related workers including supervisors (6%)
- Top executives (5%)
- Sales representatives, services, wholesale and manufacturing (5%)
- Electrical equipment mechanics and other installation, maintenance, and repair occupations including supervisors (5%)
- Information and record clerks except customer service representatives (11%)
- Registered nurses (8%)
- Other sales and related workers including supervisors (7%)
- Secretaries and administrative assistants (7%)
- Other teachers and instructors, education, training, and library occupations (6%)
- Other office and administrative support workers including supervisors (6%)
- Bookkeeping, accounting, and auditing clerks (6%)
Most common first ancestries reported in Florence township:
- German (52.3%)
- English (6.2%)
- United States or American (4.6%)
- Irish (4.6%)
- French (except Basque) (3.4%)
- Polish (3.4%)
- Norwegian (3.2%)
Most common places of birth for the foreign-born residents:
- Canada (57%)
- Honduras (43%)
Means of transportation to work:
- Drove a car alone: 615 (91%)
- Carpooled: 25 (4%)
- Walked: 3 (0%)
- Worked at home: 31 (5%)
Most commonly used house heating fuel:
- Utility gas (55%)
- Bottled, tank, or LP gas (21%)
- Electricity (13%)
- Fuel oil, kerosene, etc. (10%)
- Wood (1%)
98.3% of residents of Florence township speak English at home.
1.3% of residents speak Spanish at home (35% speak English very well, 65% speak English well).
0.4% of residents speak Asian or Pacific Island language at home (100% speak English well).
Household type by relationship:
Households: 1,339- In family households: 1,237 (394 male householders, 24 female householders)
402 spouses, 376 children (364 natural, 4 adopted, 8 stepchildren), 22 grandchildren, 5 brothers or sisters, 0 parents, 4 other relatives, 10 non-relatives
- In nonfamily households: 102 (46 male householders (31 living alone)), 40 female householders (40 living alone)), 16 nonrelatives
Size of family households: 213 2-persons, 77 3-persons, 76 4-persons, 31 5-persons, 17 6-persons, 4 7-or-more-persons,
Size of nonfamily households: 71 1-person, 15 2-persons,
271 married couples with children.
21 single-parent households (10 men, 11 women).
Private vs. public school enrollment:
Students in private schools in grades 1 to 8 (elementary and middle school): 32
| Here: | 21.2% |
| Illinois: | 13.4% |
Students in private schools in grades 9 to 12 (high school): 3
| Here: | 3.8% |
| Illinois: | 11.1% |
Students in private undergraduate colleges: 4
| Here: | 8.7% |
| Illinois: | 25.8% |