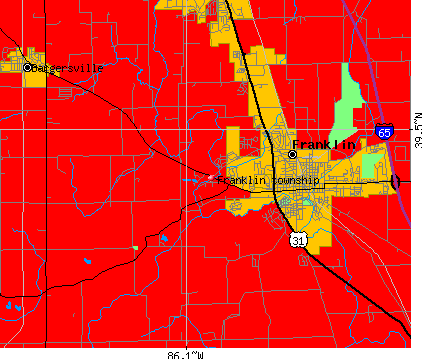
Franklin township, Johnson County, Indiana (IN) detailed profile
Number of foreign born residents: 1 (34% naturalized citizens)
| Franklin township: | 1.4% |
| Whole state: | 3.1% |
44% of Franklin township residents lived in the same house 5 years ago.
Out of people who lived in different houses, 47% lived in this county.
Out of people who lived in different counties, 71% lived in Indiana.
Place of birth for U.S.-born residents:
- This state: 14035
- Northeast: 254
- Midwest: 1491
- South: 2245
- West: 431
Median price asked for vacant for-sale houses in 2000: $92,000
Percentage of households with unmarried partners: 5.6%
Likely homosexual households (counted as self-reported same-sex unmarried-partner households)
- Lesbian couples: 0.2% of all households
- Gay men: 0.2% of all households
People in group quarters in Franklin township, Indiana:
- 721 people in other noninstitutional group quarters
- 673 people in college dormitories (includes college quarters off campus)
- 524 people in nursing homes
- 200 people in local jails and other confinement facilities (including police lockups)
- 48 people in short-term care, detention or diagnostic centers for delinquent children
- 13 people in homes for the mentally ill
- 8 people in schools, hospitals, or wards for the mentally retarded
- 4 people in homes for the mentally retarded

Housing units in structures:
- One, detached: 4,411
- One, attached: 503
- Two: 501
- 3 or 4: 288
- 5 to 9: 297
- 10 to 19: 226
- 20 to 49: 6
- 50 or more: 130
- Mobile homes: 563
Median worth of mobile homes: $19,500
Housing units in Franklin township with a mortgage: 2,536 (229 second mortgage, 254 home equity loan, 0 both second mortgage and home equity loan)
Houses without a mortgage: 991
- Construction (15%)
- Transportation equipment (7%)
- Metal and metal products (6%)
- Accommodation and food services (5%)
- Machinery (5%)
- Educational services (5%)
- Health care (4%)
- Health care (17%)
- Educational services (13%)
- Finance and insurance (7%)
- Accommodation and food services (7%)
- Transportation equipment (6%)
- Department and other general merchandise stores (5%)
- Professional, scientific, and technical services (4%)
- Metal workers and plastic workers (7%)
- Other production occupations including supervisors (7%)
- Electrical equipment mechanics and other installation, maintenance, and repair occupations including supervisors (5%)
- Other management occupations except farmers and farm managers (4%)
- Building and grounds cleaning and maintenance occupations (4%)
- Vehicle and mobile equipment mechanics, installers, and repairers (4%)
- Assemblers and fabricators (4%)
- Other office and administrative support workers including supervisors (6%)
- Secretaries and administrative assistants (6%)
- Other production occupations including supervisors (5%)
- Preschool, kindergarten, elementary and middle school teachers (5%)
- Cooks and food preparation workers (4%)
- Cashiers (4%)
- Health technologists and technicians (4%)
Most common first ancestries reported in Franklin township:
- German (22.7%)
- United States or American (20.9%)
- Irish (11.9%)
- English (10.8%)
- Scottish (3.1%)
- Dutch (2.7%)
- Scotch-Irish (2.5%)
Most common places of birth for the foreign-born residents:
- Canada (19%)
- Mexico (16%)
- Other Eastern Africa (15%)
- Costa Rica (13%)
- India (8%)
- China, excluding Hong Kong and Taiwan (6%)
- Laos (6%)
Means of transportation to work:
- Drove a car alone: 7,506 (84%)
- Carpooled: 777 (9%)
- Bus or trolley bus: 18 (0%)
- Motorcycle: 18 (0%)
- Bicycle: 66 (1%)
- Walked: 272 (3%)
- Other means: 84 (1%)
- Worked at home: 215 (2%)
Most commonly used house heating fuel:
- Utility gas (78%)
- Electricity (20%)
- Wood (1%)
People in group quarters in Franklin township, Indiana:
- 721 people in other noninstitutional group quarters
- 673 people in college dormitories (includes college quarters off campus)
- 524 people in nursing homes
- 200 people in local jails and other confinement facilities (including police lockups)
- 48 people in short-term care, detention or diagnostic centers for delinquent children
- 13 people in homes for the mentally ill
- 8 people in schools, hospitals, or wards for the mentally retarded
- 4 people in homes for the mentally retarded
96.6% of residents of Franklin township speak English at home.
1.7% of residents speak Spanish at home (72% speak English very well, 26% speak English well, 2% speak English not well).
1.0% of residents speak other Indo-European language at home (92% speak English very well, 8% speak English not well).
0.6% of residents speak Asian or Pacific Island language at home (60% speak English very well, 14% speak English well, 26% speak English not well).
0.1% of residents speak other language at home (45% speak English very well, 55% speak English well).
Household type by relationship:
Households: 16,666- In family households: 14,373 (3,214 male householders, 1,382 female householders)
3,625 spouses, 5,286 children (4,767 natural, 127 adopted, 392 stepchildren), 166 grandchildren, 103 brothers or sisters, 118 parents, 107 other relatives, 372 non-relatives
- In nonfamily households: 2,293 (784 male householders (594 living alone)), 1,007 female householders (872 living alone)), 502 nonrelatives
- In group quarters: 2,177 (810 institutionalized population)
Size of family households: 1,916 2-persons, 1,052 3-persons, 1,022 4-persons, 443 5-persons, 130 6-persons, 33 7-or-more-persons,
Size of nonfamily households: 1,466 1-person, 226 2-persons, 62 3-persons, 16 4-persons, 10 5-persons, 11 7-or-more-persons,
3,216 married couples with children.
1,051 single-parent households (246 men, 805 women).
Private vs. public school enrollment:
Students in private schools in grades 1 to 8 (elementary and middle school): 50
| Here: | 2.3% |
| Indiana: | 11.8% |
Students in private schools in grades 9 to 12 (high school): 28
| Here: | 3.2% |
| Indiana: | 8.8% |
Students in private undergraduate colleges: 792
| Here: | 68.5% |
| Indiana: | 23.4% |