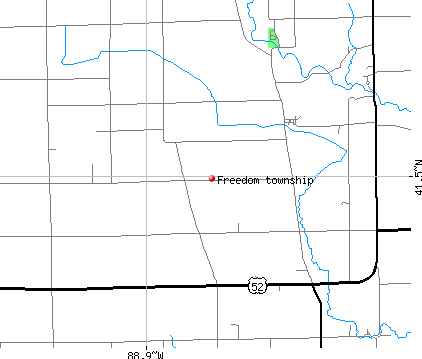
Freedom township, La Salle County, Illinois (IL) detailed profile
Number of foreign born residents: 1 (80% naturalized citizens)
| Freedom township: | 1.4% |
| Whole state: | 12.3% |
79% of Freedom township residents lived in the same house 5 years ago.
Out of people who lived in different houses, 59% lived in this county.
Out of people who lived in different counties, 84% lived in Illinois.
Place of birth for U.S.-born residents:
- This state: 625
- Northeast: 5
- Midwest: 38
- South: 27
- West: 0
Median price asked for vacant for-sale houses in 2000: $65,000
Percentage of households with unmarried partners: 1.3%
No gay or lesbian households reported
Housing units in structures:
- One, detached: 218
- Two: 7
- 3 or 4: 2
- 5 to 9: 2
- Mobile homes: 19
Median worth of mobile homes: $32,500
Housing units in Freedom township with a mortgage: 102 (0 second mortgage, 6 home equity loan, 0 both second mortgage and home equity loan)
Houses without a mortgage: 45
- Construction (24%)
- Agriculture, forestry, fishing and hunting (20%)
- Truck transportation (10%)
- Broadcasting, internet publishing, and telecommunications services (7%)
- Motor vehicle and parts dealers (6%)
- Accommodation and food services (6%)
- Building material and garden equipment and supplies dealers (4%)
- Educational services (22%)
- Health care (13%)
- Food and beverage stores (8%)
- Real estate and rental and leasing (8%)
- Computer and electronic products (7%)
- Office supplies and stationery stores (6%)
- Religious, grantmaking, civic, professional, and similar organizations (5%)
- Farmers and farm managers (18%)
- Driver/sales workers and truck drivers (11%)
- Painters and paperhangers (6%)
- Other management occupations except farmers and farm managers (6%)
- Construction trades workers except carpenters, electricians, painters, plumbers, and construction laborers (5%)
- Top executives (4%)
- Construction laborers (4%)
- Other office and administrative support workers including supervisors (13%)
- Other sales and related workers including supervisors (12%)
- Preschool, kindergarten, elementary and middle school teachers (11%)
- Registered nurses (5%)
- Nursing, psychiatric, and home health aides (5%)
- Sales representatives, services, wholesale and manufacturing (5%)
- Postsecondary teachers (5%)
Most common first ancestries reported in Freedom township:
- German (25.9%)
- Irish (20.7%)
- Norwegian (17.2%)
- United States or American (8.3%)
- English (5.3%)
- European (3.7%)
- Italian (3.7%)
Most common places of birth for the foreign-born residents:
- Canada (70%)
- Italy (20%)
Means of transportation to work:
- Drove a car alone: 280 (88%)
- Carpooled: 20 (6%)
- Walked: 3 (1%)
- Worked at home: 14 (4%)
Most commonly used house heating fuel:
- Bottled, tank, or LP gas (54%)
- Utility gas (26%)
- Fuel oil, kerosene, etc. (9%)
- Electricity (7%)
- Wood (5%)
94.6% of residents of Freedom township speak English at home.
3.2% of residents speak Spanish at home (62% speak English very well, 5% speak English well, 33% speak English not well).
2.3% of residents speak other Indo-European language at home (80% speak English very well, 13% speak English well, 7% speak English not well).
Household type by relationship:
Households: 715- In family households: 674 (187 male householders, 33 female householders)
204 spouses, 237 children (204 natural, 7 adopted, 26 stepchildren), 2 grandchildren, 0 brothers or sisters, 0 parents, 1 other relatives, 10 non-relatives
- In nonfamily households: 41 (9 male householders (4 living alone)), 22 female householders (22 living alone)), 10 nonrelatives
Size of family households: 120 2-persons, 24 3-persons, 40 4-persons, 21 5-persons, 12 6-persons, 3 7-or-more-persons,
Size of nonfamily households: 26 1-person, 5 3-persons,
196 married couples with children.
8 single-parent households (1 men, 7 women).
Private vs. public school enrollment:
Students in private schools in grades 1 to 8 (elementary and middle school): 10
| Here: | 9.9% |
| Illinois: | 13.4% |
Students in private schools in grades 9 to 12 (high school): 19
| Here: | 34.5% |
| Illinois: | 11.1% |
Students in private undergraduate colleges: 0
| Here: | 0.0% |
| Illinois: | 25.8% |