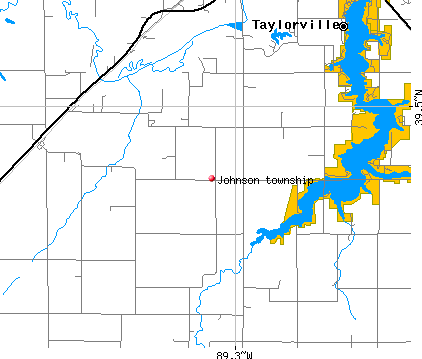
Johnson township, Christian County, Illinois (IL) detailed profile
Number of foreign born residents: 1 (100% naturalized citizens)
| Johnson township: | 0.9% |
| Whole state: | 12.3% |
62% of Johnson township residents lived in the same house 5 years ago.
Out of people who lived in different houses, 70% lived in this county.
Out of people who lived in different counties, 48% lived in Illinois.
Place of birth for U.S.-born residents:
- This state: 508
- Northeast: 0
- Midwest: 67
- South: 24
- West: 0
Median price asked for vacant for-sale houses in 2000: $85,000
Percentage of households with unmarried partners: 5.2%
No gay or lesbian households reported

Housing units in structures:
- One, detached: 208
- 3 or 4: 13
- Mobile homes: 19
Median worth of mobile homes: $66,700
Housing units in Johnson township with a mortgage: 82 (24 second mortgage, 6 home equity loan, 0 both second mortgage and home equity loan)
Houses without a mortgage: 42
- Construction (20%)
- Agriculture, forestry, fishing and hunting (17%)
- Broadcasting, internet publishing, and telecommunications services (6%)
- Finance and insurance (6%)
- Professional, scientific, and technical services (6%)
- Metal and metal products (5%)
- Radio, TV, and computer stores (5%)
- Educational services (21%)
- Accommodation and food services (14%)
- Professional, scientific, and technical services (13%)
- Finance and insurance (6%)
- Real estate and rental and leasing (6%)
- Personal and laundry services (6%)
- U. S. Postal service (5%)
- Electrical equipment mechanics and other installation, maintenance, and repair occupations including supervisors (13%)
- Farmers and farm managers (11%)
- Top executives (9%)
- Construction trades workers except carpenters, electricians, painters, plumbers, and construction laborers (9%)
- Metal workers and plastic workers (8%)
- Supervisors of construction and extraction workers (5%)
- Religious workers (4%)
- Other teachers and instructors, education, training, and library occupations (9%)
- Secretaries and administrative assistants (9%)
- Legal support workers (8%)
- Waiters and waitresses (8%)
- Bookkeeping, accounting, and auditing clerks (7%)
- Building and grounds cleaning and maintenance occupations (6%)
- Other food preparation and serving workers including supervisors (6%)
Most common first ancestries reported in Johnson township:
- United States or American (23.3%)
- German (23.1%)
- Polish (10.4%)
- Irish (9.9%)
- English (8.1%)
- Dutch (6.2%)
- Italian (2.9%)
Most common places of birth for the foreign-born residents:
- Canada (100%)
Means of transportation to work:
- Drove a car alone: 238 (76%)
- Carpooled: 44 (14%)
- Bus or trolley bus: 2 (1%)
- Worked at home: 30 (10%)
Most commonly used house heating fuel:
- Bottled, tank, or LP gas (62%)
- Electricity (23%)
- Utility gas (8%)
- Wood (5%)
- Other fuel (2%)
97.8% of residents of Johnson township speak English at home.
2.2% of residents speak other Indo-European language at home (100% speak English very well).
Household type by relationship:
Households: 612- In family households: 546 (169 male householders, 10 female householders)
156 spouses, 171 children (161 natural, 5 adopted, 5 stepchildren), 6 grandchildren, 0 brothers or sisters, 0 parents, 0 other relatives, 34 non-relatives
- In nonfamily households: 66 (29 male householders (21 living alone)), 20 female householders (20 living alone)), 17 nonrelatives
Size of family households: 75 2-persons, 24 3-persons, 54 4-persons, 23 5-persons, 3 6-persons,
Size of nonfamily households: 41 1-person, 3 2-persons, 5 3-persons,
147 married couples with children.
25 single-parent households (13 men, 12 women).
Private vs. public school enrollment:
Students in private schools in grades 1 to 8 (elementary and middle school): 5
| Here: | 5.2% |
| Illinois: | 13.4% |
Students in private schools in grades 9 to 12 (high school): 12
| Here: | 25.0% |
| Illinois: | 11.1% |
Students in private undergraduate colleges: 0
| Here: | 0.0% |
| Illinois: | 25.8% |