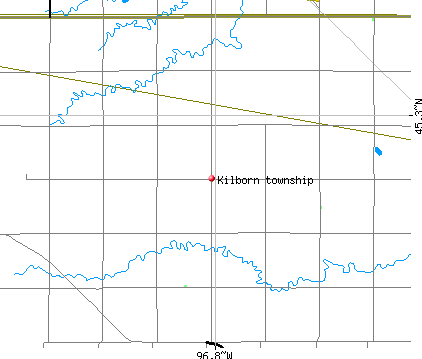
Kilborn township, Grant County, South Dakota (SD) detailed profile
Land area: 35.8 sq. mi.
Water area: 0.0 sq. mi.
Population: 157 (all rural)
| Males: 71 | |
| Females: 86 |
Occupied houses/apartments: 157 (138 owner occupied, 19 renter occupied)
| % of renters here: | 12% |
| State: | 32% |
Races in Kilborn township:
- White Non-Hispanic: 99.4%
- American Indian and Alaska Native: 0.6%
Median age of males: 41.3
Median age of females: 37.3
Discuss South Dakota on our huge forum. We have over 16 million posts!
Average household size: 2.62
| Kilborn township: | 2.6 people |
| South Dakota: | 2.5 people |
Average family size: 3.11
| Kilborn township: | $48,355 |
| South Dakota: | $48,947 |
| Here: | $421 |
| State: | $529 |
Estimated median house or condo value in 2013: $105,054 (it was $60,500 in 2000)
| : | $105,054 |
| South Dakota: | $138,400 |
| Population density: 4 people per square mile | (very low). |
| This township: | 7.1% |
| Whole state: | 13.2% |
79% of Kilborn township residents lived in the same house 5 years ago.
Out of people who lived in different houses, 0% lived in this county.
Out of people who lived in different counties, 100% lived in South Dakota.
Place of birth for U.S.-born residents:
- This state: 42
- Northeast: 0
- Midwest: 0
- South: 0
- West: 0
Median price asked for vacant for-sale houses in 2000: $9,999
Percentage of households with unmarried partners: 3.3%
Likely homosexual households (counted as self-reported same-sex unmarried-partner households)
- Lesbian couples: 1.7% of all households
- Gay men: 0.0% of all households
Housing units in structures:
- One, detached: 21
- 5 to 9: 3
Housing units in Kilborn township with a mortgage: 4 (0 second mortgage, 0 home equity loan, 0 both second mortgage and home equity loan)
Houses without a mortgage: 0
- Construction (27%)
- Truck transportation (8%)
- Nonmetallic mineral products (8%)
- Metal and metal products (8%)
- Agriculture, forestry, fishing and hunting (6%)
- Repair and maintenance (5%)
- Building material and garden equipment and supplies dealers (5%)
- Health care (15%)
- Accommodation and food services (15%)
- Educational services (10%)
- Public administration (8%)
- Department and other general merchandise stores (6%)
- Finance and insurance (6%)
- Social assistance (5%)
- Driver/sales workers and truck drivers (16%)
- Construction trades workers except carpenters, electricians, painters, plumbers, and construction laborers (9%)
- Metal workers and plastic workers (8%)
- Laborers and material movers, hand (8%)
- Vehicle and mobile equipment mechanics, installers, and repairers (6%)
- Carpenters (5%)
- Farmers and farm managers (4%)
- Material recording, scheduling, dispatching, and distributing workers (6%)
- Information and record clerks except customer service representatives (6%)
- Cooks and food preparation workers (6%)
- Supervisors and other personal care and service workers except personal appearance, transportation, and child care workers (5%)
- Accountants and auditors (5%)
- Secretaries and administrative assistants (5%)
- Health technologists and technicians (5%)
Most common first ancestries reported in Kilborn township:
- German (57.5%)
- French (except Basque) (7.5%)
- Dutch (5.0%)
- Russian (5.0%)
Means of transportation to work:
- Drove a car alone: 8 (40%)
- Bus or trolley bus: 2 (10%)
- Walked: 10 (50%)
Most commonly used house heating fuel:
- Fuel oil, kerosene, etc. (53%)
- Bottled, tank, or LP gas (24%)
- Electricity (24%)
92.9% of residents of Kilborn township speak English at home.
7.1% of residents speak other Indo-European language at home (100% speak English very well).
Household type by relationship:
Households: 42- In family households: 39 (14 male householders, 0 female householders)
14 spouses, 11 children (11 natural, 0 adopted, 0 stepchildren), 0 grandchildren, 0 brothers or sisters, 0 parents, 0 other relatives, 0 non-relatives
- In nonfamily households: 3 (3 male householders (3 living alone)), 0 female householders (0 living alone)), 0 nonrelatives
Size of family households: 6 2-persons, 5 3-persons, 3 5-persons,
Size of nonfamily households: 3 1-person,
38 married couples with children.
1 single-parent households (1 men, 0 women).
Private vs. public school enrollment:
Students in private schools in grades 1 to 8 (elementary and middle school): 0
| Here: | 0.0% |
| South Dakota: | 8.0% |
Students in private schools in grades 9 to 12 (high school): 0
| Here: | 0.0% |
| South Dakota: | 5.6% |