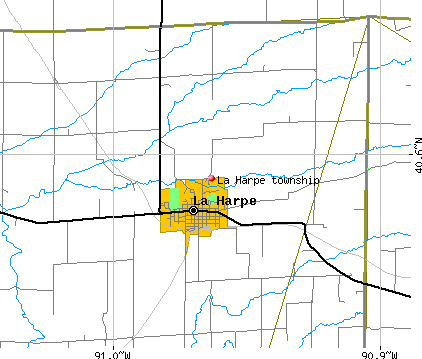
La Harpe township, Hancock County, Illinois (IL) detailed profile
Number of foreign born residents: 1 (18% naturalized citizens)
| La Harpe township: | 0.7% |
| Whole state: | 12.3% |
64% of La Harpe township residents lived in the same house 5 years ago.
Out of people who lived in different houses, 64% lived in this county.
Out of people who lived in different counties, 44% lived in Illinois.
Place of birth for U.S.-born residents:
- This state: 1161
- Northeast: 10
- Midwest: 329
- South: 64
- West: 20
Median price asked for vacant for-sale houses in 2000: $72,500
Percentage of households with unmarried partners: 2.6%
Likely homosexual households (counted as self-reported same-sex unmarried-partner households)
- Lesbian couples: 0.0% of all households
- Gay men: 0.2% of all households
44 people in nursing homes

Housing units in structures:
- One, detached: 555
- One, attached: 2
- Two: 4
- 3 or 4: 22
- 5 to 9: 19
- 10 to 19: 4
- Mobile homes: 87
Median worth of mobile homes: $17,800
Housing units in La Harpe township with a mortgage: 211 (17 second mortgage, 9 home equity loan, 0 both second mortgage and home equity loan)
Houses without a mortgage: 223
- Construction (17%)
- Educational services (11%)
- Motor vehicle and parts dealers (6%)
- Metal and metal products (6%)
- Truck transportation (6%)
- Agriculture, forestry, fishing and hunting (6%)
- Transportation equipment (5%)
- Educational services (16%)
- Health care (16%)
- Transportation equipment (10%)
- Accommodation and food services (7%)
- Food and beverage stores (7%)
- Finance and insurance (5%)
- Social assistance (4%)
- Other production occupations including supervisors (10%)
- Driver/sales workers and truck drivers (8%)
- Vehicle and mobile equipment mechanics, installers, and repairers (7%)
- Retail sales workers except cashiers (6%)
- Building and grounds cleaning and maintenance occupations (5%)
- Electrical equipment mechanics and other installation, maintenance, and repair occupations including supervisors (5%)
- Other management occupations except farmers and farm managers (5%)
- Assemblers and fabricators (9%)
- Preschool, kindergarten, elementary and middle school teachers (8%)
- Secretaries and administrative assistants (7%)
- Cooks and food preparation workers (5%)
- Registered nurses (5%)
- Nursing, psychiatric, and home health aides (5%)
- Other sales and related workers including supervisors (4%)
Most common first ancestries reported in La Harpe township:
- United States or American (26.8%)
- German (24.6%)
- English (17.1%)
- Irish (8.2%)
- Swedish (3.7%)
- French (except Basque) (2.6%)
- Scottish (2.5%)
Most common places of birth for the foreign-born residents:
- Germany (55%)
- Venezuela (45%)
Means of transportation to work:
- Drove a car alone: 578 (76%)
- Carpooled: 103 (13%)
- Walked: 41 (5%)
- Other means: 5 (1%)
- Worked at home: 37 (5%)
Most commonly used house heating fuel:
- Utility gas (85%)
- Bottled, tank, or LP gas (10%)
- Electricity (4%)
44 people in nursing homes
98.8% of residents of La Harpe township speak English at home.
0.4% of residents speak Spanish at home (17% speak English very well, 67% speak English well, 17% speak English not well).
0.8% of residents speak other Indo-European language at home (100% speak English very well).
Household type by relationship:
Households: 1,563- In family households: 1,329 (365 male householders, 69 female householders)
375 spouses, 482 children (410 natural, 27 adopted, 45 stepchildren), 10 grandchildren, 6 brothers or sisters, 0 parents, 2 other relatives, 20 non-relatives
- In nonfamily households: 234 (82 male householders (69 living alone)), 112 female householders (106 living alone)), 40 nonrelatives
- In group quarters: 44 (all institutionalized)
Size of family households: 206 2-persons, 91 3-persons, 83 4-persons, 37 5-persons, 13 6-persons, 4 7-or-more-persons,
Size of nonfamily households: 175 1-person, 11 2-persons, 4 3-persons, 4 6-persons,
318 married couples with children.
76 single-parent households (19 men, 57 women).
Private vs. public school enrollment:
Students in private schools in grades 1 to 8 (elementary and middle school): 14
| Here: | 6.8% |
| Illinois: | 13.4% |
Students in private schools in grades 9 to 12 (high school): 4
| Here: | 3.7% |
| Illinois: | 11.1% |
Students in private undergraduate colleges: 0
| Here: | 0.0% |
| Illinois: | 25.8% |