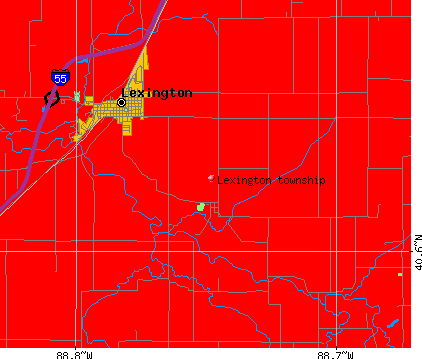
Lexington township, McLean County, Illinois (IL) detailed profile
Number of foreign born residents: 1 (53% naturalized citizens)
| Lexington township: | 0.6% |
| Whole state: | 12.3% |
58% of Lexington township residents lived in the same house 5 years ago.
Out of people who lived in different houses, 80% lived in this county.
Out of people who lived in different counties, 64% lived in Illinois.
Place of birth for U.S.-born residents:
- This state: 1946
- Northeast: 16
- Midwest: 171
- South: 112
- West: 41
Median price asked for vacant for-sale houses in 2000: $112,500
Percentage of households with unmarried partners: 3.7%
Likely homosexual households (counted as self-reported same-sex unmarried-partner households)
- Lesbian couples: 0.1% of all households
- Gay men: 0.0% of all households

Housing units in structures:
- One, detached: 798
- One, attached: 4
- Two: 45
- 3 or 4: 20
- 5 to 9: 20
- 10 to 19: 7
- Mobile homes: 72
Median worth of mobile homes: $15,500
Housing units in Lexington township with a mortgage: 422 (43 second mortgage, 37 home equity loan, 4 both second mortgage and home equity loan)
Houses without a mortgage: 181
- Construction (14%)
- Finance and insurance (7%)
- Agriculture, forestry, fishing and hunting (6%)
- Machinery (5%)
- Repair and maintenance (5%)
- Educational services (5%)
- Transportation equipment (4%)
- Finance and insurance (23%)
- Educational services (13%)
- Health care (12%)
- Accommodation and food services (8%)
- Social assistance (6%)
- Professional, scientific, and technical services (4%)
- Administrative and support and waste management services (3%)
- Electrical equipment mechanics and other installation, maintenance, and repair occupations including supervisors (7%)
- Metal workers and plastic workers (6%)
- Driver/sales workers and truck drivers (6%)
- Other management occupations except farmers and farm managers (5%)
- Computer specialists (4%)
- Farmers and farm managers (4%)
- Laborers and material movers, hand (4%)
- Secretaries and administrative assistants (9%)
- Other office and administrative support workers including supervisors (8%)
- Registered nurses (5%)
- Preschool, kindergarten, elementary and middle school teachers (5%)
- Child care workers (5%)
- Business operations specialists (4%)
- Health technologists and technicians (4%)
Most common first ancestries reported in Lexington township:
- German (33.7%)
- United States or American (17.9%)
- Irish (11.6%)
- English (11.0%)
- French (except Basque) (3.1%)
- Dutch (2.5%)
- Swedish (2.4%)
Most common places of birth for the foreign-born residents:
- Austria (27%)
- Germany (13%)
- Belarus (13%)
- Other Eastern Europe (13%)
- Other Australian and New Zealand Subregion (13%)
- Guyana (13%)
Means of transportation to work:
- Drove a car alone: 993 (80%)
- Carpooled: 145 (12%)
- Bus or trolley bus: 2 (0%)
- Bicycle: 2 (0%)
- Walked: 30 (2%)
- Other means: 2 (0%)
- Worked at home: 64 (5%)
Most commonly used house heating fuel:
- Utility gas (82%)
- Bottled, tank, or LP gas (10%)
- Electricity (6%)
- Fuel oil, kerosene, etc. (1%)
98.2% of residents of Lexington township speak English at home.
1.6% of residents speak Spanish at home (65% speak English very well, 6% speak English well, 29% speak English not well).
0.2% of residents speak other Indo-European language at home (60% speak English very well, 40% speak English not well).
Household type by relationship:
Households: 2,321- In family households: 2,046 (543 male householders, 121 female householders)
542 spouses, 779 children (722 natural, 12 adopted, 45 stepchildren), 16 grandchildren, 2 brothers or sisters, 9 parents, 14 other relatives, 20 non-relatives
- In nonfamily households: 275 (106 male householders (97 living alone)), 137 female householders (124 living alone)), 32 nonrelatives
Size of family households: 281 2-persons, 159 3-persons, 130 4-persons, 78 5-persons, 12 6-persons, 4 7-or-more-persons,
Size of nonfamily households: 221 1-person, 18 2-persons, 4 3-persons,
482 married couples with children.
114 single-parent households (24 men, 90 women).
Private vs. public school enrollment:
Students in private schools in grades 1 to 8 (elementary and middle school): 6
| Here: | 2.2% |
| Illinois: | 13.4% |
Students in private schools in grades 9 to 12 (high school): 5
| Here: | 2.9% |
| Illinois: | 11.1% |
Students in private undergraduate colleges: 4
| Here: | 4.6% |
| Illinois: | 25.8% |