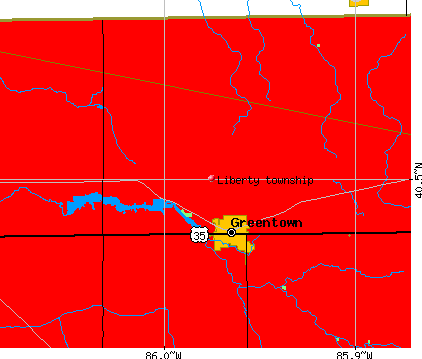
Liberty township, Howard County, Indiana (IN) detailed profile
Number of foreign born residents: 0 (100% naturalized citizens)
| Liberty township: | 0.2% |
| Whole state: | 3.1% |
61% of Liberty township residents lived in the same house 5 years ago.
Out of people who lived in different houses, 70% lived in this county.
Out of people who lived in different counties, 76% lived in Indiana.
Place of birth for U.S.-born residents:
- This state: 4420
- Northeast: 51
- Midwest: 348
- South: 337
- West: 45
Median price asked for vacant for-sale houses in 2000: $129,200
Percentage of households with unmarried partners: 2.3%
Likely homosexual households (counted as self-reported same-sex unmarried-partner households)
- Lesbian couples: 0.2% of all households
- Gay men: 0.0% of all households
69 people in nursing homes
Housing units in structures:
- One, detached: 1,684
- One, attached: 22
- Two: 19
- 3 or 4: 18
- 5 to 9: 30
- 10 to 19: 17
- 20 to 49: 57
- 50 or more: 16
- Mobile homes: 108
Median worth of mobile homes: $11,000
Housing units in Liberty township with a mortgage: 1,016 (104 second mortgage, 137 home equity loan, 8 both second mortgage and home equity loan)
Houses without a mortgage: 331
- Transportation equipment (21%)
- Construction (10%)
- Computer and electronic products (9%)
- Educational services (6%)
- Motor vehicle and parts dealers (5%)
- Metal and metal products (5%)
- Health care (5%)
- Educational services (19%)
- Health care (18%)
- Computer and electronic products (8%)
- Transportation equipment (6%)
- Accommodation and food services (6%)
- Personal and laundry services (5%)
- Social assistance (4%)
- Electrical equipment mechanics and other installation, maintenance, and repair occupations including supervisors (10%)
- Metal workers and plastic workers (8%)
- Other production occupations including supervisors (8%)
- Other management occupations except farmers and farm managers (8%)
- Engineers (6%)
- Assemblers and fabricators (5%)
- Cooks and food preparation workers (4%)
- Other office and administrative support workers including supervisors (8%)
- Other production occupations including supervisors (7%)
- Secretaries and administrative assistants (6%)
- Registered nurses (6%)
- Preschool, kindergarten, elementary and middle school teachers (6%)
- Other teachers and instructors, education, training, and library occupations (6%)
- Personal appearance workers (4%)
Most common first ancestries reported in Liberty township:
- United States or American (36.4%)
- German (21.7%)
- English (10.1%)
- Irish (8.4%)
- Dutch (3.1%)
- European (2.4%)
- French (except Basque) (1.9%)
Most common places of birth for the foreign-born residents:
- Poland (100%)
Means of transportation to work:
- Drove a car alone: 2,197 (85%)
- Carpooled: 211 (8%)
- Bicycle: 55 (2%)
- Walked: 33 (1%)
- Other means: 9 (0%)
- Worked at home: 77 (3%)
Most commonly used house heating fuel:
- Utility gas (53%)
- Electricity (33%)
- Bottled, tank, or LP gas (10%)
- Fuel oil, kerosene, etc. (2%)
- Other fuel (1%)
- Wood (1%)
69 people in nursing homes
96.2% of residents of Liberty township speak English at home.
1.3% of residents speak Spanish at home (59% speak English very well, 29% speak English well, 12% speak English not well).
2.5% of residents speak other Indo-European language at home (52% speak English very well, 32% speak English well, 16% speak English not well).
Household type by relationship:
Households: 5,150- In family households: 4,703 (1,326 male householders, 168 female householders)
1,252 spouses, 1,831 children (1,616 natural, 44 adopted, 171 stepchildren), 55 grandchildren, 40 brothers or sisters, 0 parents, 11 other relatives, 20 non-relatives
- In nonfamily households: 447 (142 male householders (132 living alone)), 266 female householders (251 living alone)), 39 nonrelatives
- In group quarters: 66 (all institutionalized)
Size of family households: 607 2-persons, 319 3-persons, 329 4-persons, 150 5-persons, 72 6-persons, 17 7-or-more-persons,
Size of nonfamily households: 383 1-person, 21 2-persons, 4 4-persons,
1,110 married couples with children.
202 single-parent households (42 men, 160 women).
Private vs. public school enrollment:
Students in private schools in grades 1 to 8 (elementary and middle school): 44
| Here: | 6.1% |
| Indiana: | 11.8% |
Students in private schools in grades 9 to 12 (high school): 18
| Here: | 4.3% |
| Indiana: | 8.8% |
Students in private undergraduate colleges: 21
| Here: | 18.9% |
| Indiana: | 23.4% |