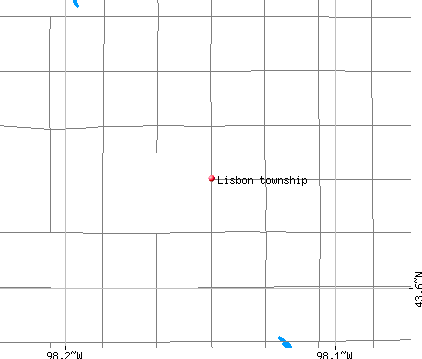
Lisbon township, Davison County, South Dakota (SD) detailed profile
Land area: 36.2 sq. mi.
Water area: 0.0 sq. mi.
Population: 168 (all rural)
| Males: 95 | |
| Females: 73 |
Occupied houses/apartments: 168 (142 owner occupied, 26 renter occupied)
| % of renters here: | 15% |
| State: | 32% |
Races in Lisbon township:
- White Non-Hispanic: 100.0%
Median age of males: 35.9
Median age of females: 38.8
Discuss South Dakota on our huge forum. We have over 16 million posts!
Average household size: 3.00
| Lisbon township: | 3.0 people |
| South Dakota: | 2.5 people |
Average family size: 3.20
| Lisbon township: | $47,806 |
| South Dakota: | $48,947 |
| Here: | $501 |
| State: | $529 |
Estimated median house or condo value in 2013: $128,888 (it was $69,600 in 2000)
| : | $128,888 |
| South Dakota: | $138,400 |
| Population density: 5 people per square mile | (very low). |
| This township: | 14.7% |
| Whole state: | 13.2% |
Notable locations in this township outside city limits:
Park in Lisbon township: Hubbard Slough State Public Shooting Area (1). Display/hide its location on the map
75% of Lisbon township residents lived in the same house 5 years ago.
Out of people who lived in different houses, 43% lived in this county.
Out of people who lived in different counties, 100% lived in South Dakota.
Place of birth for U.S.-born residents:
- This state: 164
- Northeast: 0
- Midwest: 13
- South: 0
- West: 7
Percentage of households with unmarried partners: 1.8%
No gay or lesbian households reported
Housing units in structures:
- One, detached: 49
- Mobile homes: 15
Median worth of mobile homes: $9,999
Housing units in Lisbon township with a mortgage: 9 (0 second mortgage, 0 home equity loan, 0 both second mortgage and home equity loan)
Houses without a mortgage: 2
- Agriculture, forestry, fishing and hunting (22%)
- Publishing, and motion picture and sound recording industries (17%)
- Construction (13%)
- Miscellaneous manufacturing (11%)
- Nonmetallic mineral products (6%)
- Machinery (6%)
- Educational services (6%)
- Health care (36%)
- Publishing, and motion picture and sound recording industries (19%)
- Construction (12%)
- Professional, scientific, and technical services (10%)
- Finance and insurance (7%)
- Agriculture, forestry, fishing and hunting (5%)
- Radio, TV, and computer stores (5%)
- Other management occupations except farmers and farm managers (13%)
- Agricultural workers including supervisors (13%)
- Other office and administrative support workers including supervisors (11%)
- Assemblers and fabricators (11%)
- Farmers and farm managers (9%)
- Other production occupations including supervisors (9%)
- Religious workers (6%)
- Registered nurses (26%)
- Art and design workers (19%)
- Other office and administrative support workers including supervisors (19%)
- Other management occupations except farmers and farm managers (7%)
- Health technologists and technicians (5%)
- Other healthcare support occupations (5%)
- Other sales and related workers including supervisors (5%)
Most common first ancestries reported in Lisbon township:
- German (65.8%)
- Norwegian (21.2%)
- Irish (5.5%)
- Austrian (3.4%)
- English (2.7%)
- Polish (1.4%)
Means of transportation to work:
- Drove a car alone: 59 (61%)
- Carpooled: 23 (24%)
- Worked at home: 14 (15%)
Most commonly used house heating fuel:
- Bottled, tank, or LP gas (53%)
- Fuel oil, kerosene, etc. (40%)
- Electricity (3%)
- Other fuel (3%)
All residents speak only English at home
Household type by relationship:
Households: 184- In family households: 181 (57 male householders, 0 female householders)
41 spouses, 81 children (76 natural, 0 adopted, 5 stepchildren), 0 grandchildren, 0 brothers or sisters, 0 parents, 0 other relatives, 2 non-relatives
- In nonfamily households: 3 (0 male householders (0 living alone)), 3 female householders (3 living alone)), 0 nonrelatives
Size of family households: 29 2-persons, 8 3-persons, 9 4-persons, 4 5-persons, 7 7-or-more-persons,
Size of nonfamily households: 3 1-person,
44 married couples with children.
4 single-parent households (3 men, 1 women).
Private vs. public school enrollment:
Students in private schools in grades 1 to 8 (elementary and middle school): 2
| Here: | 5.9% |
| South Dakota: | 8.0% |
Students in private schools in grades 9 to 12 (high school): 0
| Here: | 0.0% |
| South Dakota: | 5.6% |