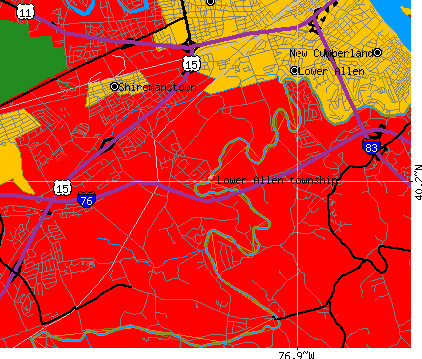
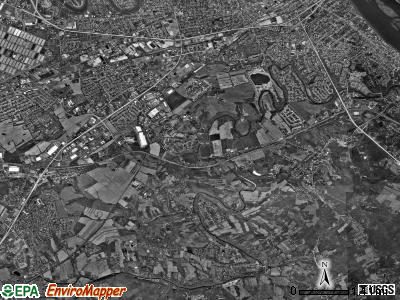
Lower Allen township, Cumberland County, Pennsylvania (PA) detailed profile
Number of foreign born residents: 5 (47% naturalized citizens)
| Lower Allen township: | 4.7% |
| Whole state: | 4.1% |
49% of Lower Allen township residents lived in the same house 5 years ago.
Out of people who lived in different houses, 30% lived in this county.
Out of people who lived in different counties, 81% lived in Pennsylvania.
Place of birth for U.S.-born residents:
- This state: 13001
- Northeast: 953
- Midwest: 500
- South: 1728
- West: 276
Median price asked for vacant for-sale houses in 2000: $99,400
Percentage of households with unmarried partners: 3.7%
Likely homosexual households (counted as self-reported same-sex unmarried-partner households)
- Lesbian couples: 0.2% of all households
- Gay men: 0.1% of all households
People in group quarters in Lower Allen township, Pennsylvania:
- 3,308 people in state prisons
- 546 people in nursing homes
- 36 people in other workers' dormitories
- 8 people in homes for the mentally retarded
- 2 people in other noninstitutional group quarters
Housing units in structures:
- One, detached: 4,144
- One, attached: 639
- Two: 77
- 3 or 4: 206
- 5 to 9: 412
- 10 to 19: 431
- 20 to 49: 173
- 50 or more: 351
- Mobile homes: 87
Median worth of mobile homes: $12,000
Housing units in Lower Allen township with a mortgage: 2,602 (358 second mortgage, 410 home equity loan, 9 both second mortgage and home equity loan)
Houses without a mortgage: 1,496
- Public administration (12%)
- Finance and insurance (9%)
- Professional, scientific, and technical services (9%)
- Construction (5%)
- Administrative and support and waste management services (5%)
- Educational services (4%)
- Accommodation and food services (4%)
- Health care (13%)
- Finance and insurance (12%)
- Public administration (12%)
- Educational services (9%)
- Professional, scientific, and technical services (8%)
- Accommodation and food services (6%)
- Social assistance (4%)
- Sales representatives, services, wholesale and manufacturing (8%)
- Other office and administrative support workers including supervisors (6%)
- Computer specialists (5%)
- Laborers and material movers, hand (5%)
- Other management occupations except farmers and farm managers (4%)
- Other sales and related workers including supervisors (4%)
- Business operations specialists (4%)
- Other office and administrative support workers including supervisors (12%)
- Secretaries and administrative assistants (7%)
- Business operations specialists (5%)
- Information and record clerks except customer service representatives (4%)
- Other sales and related workers including supervisors (4%)
- Registered nurses (4%)
- Retail sales workers except cashiers (4%)
Most common first ancestries reported in Lower Allen township:
- German (33.9%)
- Irish (11.2%)
- English (8.2%)
- United States or American (7.6%)
- Italian (6.5%)
- Polish (3.4%)
- Scotch-Irish (3.1%)
Most common places of birth for the foreign-born residents:
- Bosnia and Herzegovina (15%)
- Vietnam (10%)
- Other Western Asia (10%)
- United Kingdom (5%)
- Germany (5%)
- Laos (5%)
- Korea (4%)
Means of transportation to work:
- Drove a car alone: 5,963 (86%)
- Carpooled: 604 (9%)
- Bus or trolley bus: 73 (1%)
- Motorcycle: 17 (0%)
- Bicycle: 8 (0%)
- Walked: 76 (1%)
- Other means: 22 (0%)
- Worked at home: 137 (2%)
Most commonly used house heating fuel:
- Electricity (38%)
- Utility gas (37%)
- Fuel oil, kerosene, etc. (23%)
- Bottled, tank, or LP gas (1%)
People in group quarters in Lower Allen township, Pennsylvania:
- 3,308 people in state prisons
- 546 people in nursing homes
- 36 people in other workers' dormitories
- 8 people in homes for the mentally retarded
- 2 people in other noninstitutional group quarters
92.6% of residents of Lower Allen township speak English at home.
2.2% of residents speak Spanish at home (47% speak English very well, 21% speak English well, 31% speak English not well).
3.6% of residents speak other Indo-European language at home (84% speak English very well, 12% speak English well, 3% speak English not well, 1% don't speak English at all).
1.3% of residents speak Asian or Pacific Island language at home (46% speak English very well, 42% speak English well, 13% speak English not well).
0.3% of residents speak other language at home (48% speak English very well, 14% speak English well, 38% speak English not well).
Household type by relationship:
Households: 13,529- In family households: 10,558 (3,052 male householders, 734 female householders)
3,104 spouses, 3,166 children (2,957 natural, 76 adopted, 133 stepchildren), 97 grandchildren, 33 brothers or sisters, 59 parents, 129 other relatives, 184 non-relatives
- In nonfamily households: 2,971 (894 male householders (680 living alone)), 1,630 female householders (1,479 living alone)), 447 nonrelatives
- In group quarters: 3,908 (3,874 institutionalized population)
Size of family households: 2,118 2-persons, 828 3-persons, 560 4-persons, 207 5-persons, 68 6-persons, 5 7-or-more-persons,
Size of nonfamily households: 2,159 1-person, 304 2-persons, 46 3-persons, 6 4-persons, 9 5-persons,
1,965 married couples with children.
513 single-parent households (100 men, 413 women).
Private vs. public school enrollment:
Students in private schools in grades 1 to 8 (elementary and middle school): 172
| Here: | 14.1% |
| Pennsylvania: | 16.0% |
Students in private schools in grades 9 to 12 (high school): 163
| Here: | 20.0% |
| Pennsylvania: | 13.1% |
Students in private undergraduate colleges: 181
| Here: | 25.0% |
| Pennsylvania: | 37.3% |