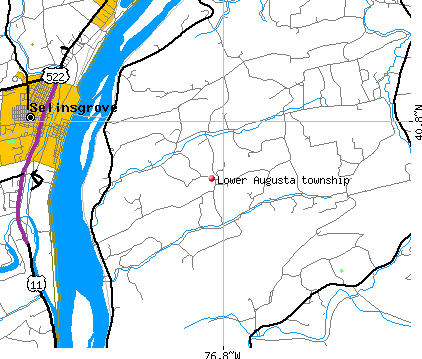
Lower Augusta township, Northumberland County, Pennsylvania (PA) detailed profile
Number of foreign born residents: 0 (100% naturalized citizens)
| Lower Augusta township: | 0.5% |
| Whole state: | 4.1% |
84% of Lower Augusta township residents lived in the same house 5 years ago.
Out of people who lived in different houses, 87% lived in this county.
Out of people who lived in different counties, 67% lived in Pennsylvania.
Place of birth for U.S.-born residents:
- This state: 1008
- Northeast: 20
- Midwest: 12
- South: 26
- West: 6
Median price asked for vacant for-sale houses in 2000: $85,000
Percentage of households with unmarried partners: 4.2%
Likely homosexual households (counted as self-reported same-sex unmarried-partner households)
- Lesbian couples: 0.2% of all households
- Gay men: 0.0% of all households
3 people in homes for the mentally retarded

Housing units in structures:
- One, detached: 371
- One, attached: 4
- Two: 2
- 3 or 4: 4
- Mobile homes: 44
Median worth of mobile homes: $62,500
Housing units in Lower Augusta township with a mortgage: 144 (16 second mortgage, 25 home equity loan, 2 both second mortgage and home equity loan)
Houses without a mortgage: 84
- Construction (13%)
- Public administration (7%)
- Agriculture, forestry, fishing and hunting (5%)
- Truck transportation (5%)
- Metal and metal products (5%)
- Food and beverage stores (4%)
- Building material and garden equipment and supplies dealers (4%)
- Health care (28%)
- Agriculture, forestry, fishing and hunting (6%)
- Accommodation and food services (5%)
- Public administration (4%)
- Apparel (4%)
- Department and other general merchandise stores (4%)
- Educational services (4%)
- Laborers and material movers, hand (11%)
- Driver/sales workers and truck drivers (8%)
- Other production occupations including supervisors (7%)
- Electrical equipment mechanics and other installation, maintenance, and repair occupations including supervisors (4%)
- Carpenters (4%)
- Assemblers and fabricators (4%)
- Farmers and farm managers (4%)
- Nursing, psychiatric, and home health aides (12%)
- Health technologists and technicians (9%)
- Other office and administrative support workers including supervisors (6%)
- Secretaries and administrative assistants (5%)
- Laborers and material movers, hand (4%)
- Assemblers and fabricators (4%)
- Textile, apparel, and furnishings workers (4%)
Most common first ancestries reported in Lower Augusta township:
- German (50.0%)
- United States or American (9.2%)
- English (8.3%)
- Polish (7.1%)
- Dutch (6.4%)
- Italian (3.8%)
- Irish (3.3%)
Most common places of birth for the foreign-born residents:
- Philippines (60%)
- Yugoslavia (40%)
Means of transportation to work:
- Drove a car alone: 485 (87%)
- Carpooled: 44 (8%)
- Bicycle: 2 (0%)
- Walked: 2 (0%)
- Other means: 2 (0%)
- Worked at home: 24 (4%)
Most commonly used house heating fuel:
- Fuel oil, kerosene, etc. (54%)
- Electricity (22%)
- Coal or coke (17%)
- Bottled, tank, or LP gas (4%)
- Wood (2%)
- No fuel used (1%)
3 people in homes for the mentally retarded
97.9% of residents of Lower Augusta township speak English at home.
1.9% of residents speak Spanish at home (65% speak English very well, 35% speak English not well).
0.2% of residents speak other Indo-European language at home (100% speak English well).
Household type by relationship:
Households: 1,076- In family households: 1,000 (280 male householders, 55 female householders)
289 spouses, 324 children (311 natural, 7 adopted, 6 stepchildren), 16 grandchildren, 4 brothers or sisters, 12 parents, 14 other relatives, 6 non-relatives
- In nonfamily households: 76 (37 male householders (33 living alone)), 28 female householders (23 living alone)), 11 nonrelatives
- In group quarters: 3 (0 institutionalized population)
Size of family households: 148 2-persons, 82 3-persons, 66 4-persons, 22 5-persons, 14 6-persons, 3 7-or-more-persons,
Size of nonfamily households: 56 1-person, 7 2-persons, 2 3-persons,
177 married couples with children.
36 single-parent households (22 men, 14 women).
Private vs. public school enrollment:
Students in private schools in grades 1 to 8 (elementary and middle school): 6
| Here: | 4.8% |
| Pennsylvania: | 16.0% |
Students in private schools in grades 9 to 12 (high school): 3
| Here: | 6.1% |
| Pennsylvania: | 13.1% |
Students in private undergraduate colleges: 11
| Here: | 40.7% |
| Pennsylvania: | 37.3% |