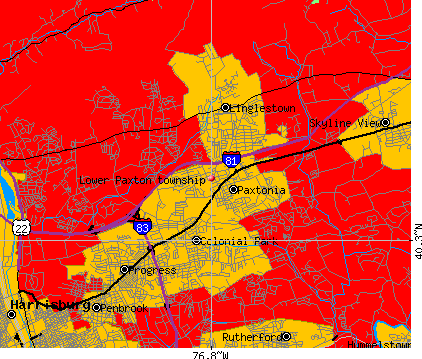
Lower Paxton township, Dauphin County, Pennsylvania (PA) detailed profile
Number of foreign born residents: 6 (48% naturalized citizens)
| Lower Paxton township: | 5.5% |
| Whole state: | 4.1% |
59% of Lower Paxton township residents lived in the same house 5 years ago.
Out of people who lived in different houses, 60% lived in this county.
Out of people who lived in different counties, 60% lived in Pennsylvania.
Place of birth for U.S.-born residents:
- This state: 32976
- Northeast: 3094
- Midwest: 1826
- South: 2898
- West: 723
Median price asked for vacant for-sale houses in 2000: $127,700
Percentage of households with unmarried partners: 4.9%
Likely homosexual households (counted as self-reported same-sex unmarried-partner households)
- Lesbian couples: 0.2% of all households
- Gay men: 0.2% of all households
People in group quarters in Lower Paxton township, Pennsylvania:
- 643 people in nursing homes
- 72 people in homes for the mentally retarded
- 64 people in schools, hospitals, or wards for the mentally retarded
- 17 people in homes for the mentally ill
- 10 people in religious group quarters
- 4 people in other nonhousehold living situations
Housing units in structures:
- One, detached: 11,498
- One, attached: 1,855
- Two: 337
- 3 or 4: 859
- 5 to 9: 1,953
- 10 to 19: 2,012
- 20 to 49: 559
- 50 or more: 409
- Mobile homes: 124
Median worth of mobile homes: $67,700
Housing units in Lower Paxton township with a mortgage: 8,328 (936 second mortgage, 1,539 home equity loan, 37 both second mortgage and home equity loan)
Houses without a mortgage: 3,220
- Public administration (14%)
- Construction (7%)
- Finance and insurance (7%)
- Professional, scientific, and technical services (7%)
- Accommodation and food services (5%)
- Health care (5%)
- Educational services (4%)
- Health care (15%)
- Public administration (14%)
- Finance and insurance (12%)
- Educational services (10%)
- Professional, scientific, and technical services (6%)
- Accommodation and food services (5%)
- Social assistance (4%)
- Other management occupations except farmers and farm managers (5%)
- Computer specialists (5%)
- Other sales and related workers including supervisors (5%)
- Driver/sales workers and truck drivers (5%)
- Sales representatives, services, wholesale and manufacturing (4%)
- Material recording, scheduling, dispatching, and distributing workers (4%)
- Other office and administrative support workers including supervisors (3%)
- Other office and administrative support workers including supervisors (9%)
- Secretaries and administrative assistants (8%)
- Preschool, kindergarten, elementary and middle school teachers (5%)
- Registered nurses (5%)
- Business operations specialists (5%)
- Other management occupations except farmers and farm managers (4%)
- Information and record clerks except customer service representatives (4%)
Most common first ancestries reported in Lower Paxton township:
- German (31.0%)
- Irish (9.9%)
- Italian (9.0%)
- United States or American (7.8%)
- English (4.8%)
- Polish (3.8%)
- Scotch-Irish (1.5%)
Most common places of birth for the foreign-born residents:
- India (16%)
- Mexico (6%)
- Philippines (5%)
- Vietnam (5%)
- United Kingdom (5%)
- Yugoslavia (4%)
- China, excluding Hong Kong and Taiwan (4%)
Means of transportation to work:
- Drove a car alone: 20,310 (86%)
- Carpooled: 1,960 (8%)
- Bus or trolley bus: 137 (1%)
- Taxi: 36 (0%)
- Motorcycle: 6 (0%)
- Bicycle: 33 (0%)
- Walked: 345 (1%)
- Other means: 137 (1%)
- Worked at home: 579 (2%)
Most commonly used house heating fuel:
- Utility gas (41%)
- Electricity (31%)
- Fuel oil, kerosene, etc. (25%)
- Bottled, tank, or LP gas (2%)
- Coal or coke (1%)
People in group quarters in Lower Paxton township, Pennsylvania:
- 643 people in nursing homes
- 72 people in homes for the mentally retarded
- 64 people in schools, hospitals, or wards for the mentally retarded
- 17 people in homes for the mentally ill
- 10 people in religious group quarters
- 4 people in other nonhousehold living situations
91.7% of residents of Lower Paxton township speak English at home.
2.7% of residents speak Spanish at home (71% speak English very well, 12% speak English well, 16% speak English not well, 1% don't speak English at all).
3.7% of residents speak other Indo-European language at home (62% speak English very well, 28% speak English well, 8% speak English not well, 2% don't speak English at all).
1.3% of residents speak Asian or Pacific Island language at home (33% speak English very well, 47% speak English well, 19% speak English not well, 1% don't speak English at all).
0.7% of residents speak other language at home (77% speak English very well, 13% speak English well, 10% speak English not well).
Household type by relationship:
Households: 43,612- In family households: 36,058 (9,834 male householders, 2,423 female householders)
10,097 spouses, 12,038 children (10,977 natural, 414 adopted, 647 stepchildren), 448 grandchildren, 288 brothers or sisters, 176 parents, 300 other relatives, 454 non-relatives
- In nonfamily households: 7,554 (2,802 male householders (2,293 living alone)), 3,578 female householders (3,054 living alone)), 1,174 nonrelatives
- In group quarters: 812 (710 institutionalized population)
Size of family households: 5,707 2-persons, 2,901 3-persons, 2,454 4-persons, 845 5-persons, 293 6-persons, 57 7-or-more-persons,
Size of nonfamily households: 5,347 1-person, 959 2-persons, 61 3-persons, 10 5-persons, 3 6-persons,
7,544 married couples with children.
1,847 single-parent households (416 men, 1,431 women).
Private vs. public school enrollment:
Students in private schools in grades 1 to 8 (elementary and middle school): 892
| Here: | 19.0% |
| Pennsylvania: | 16.0% |
Students in private schools in grades 9 to 12 (high school): 207
| Here: | 8.9% |
| Pennsylvania: | 13.1% |
Students in private undergraduate colleges: 336
| Here: | 22.2% |
| Pennsylvania: | 37.3% |