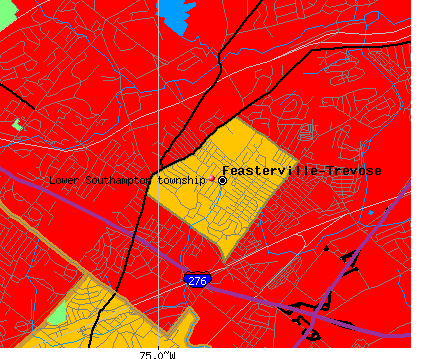
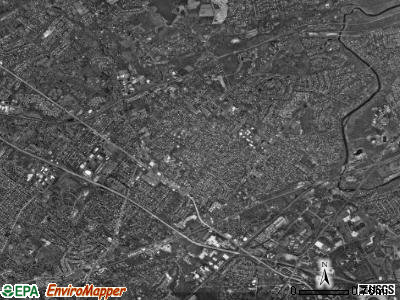
Lower Southampton township, Bucks County, Pennsylvania (PA) detailed profile
Number of foreign born residents: 8 (65% naturalized citizens)
| Lower Southampton township: | 7.7% |
| Whole state: | 4.1% |
69% of Lower Southampton township residents lived in the same house 5 years ago.
Out of people who lived in different houses, 49% lived in this county.
Out of people who lived in different counties, 78% lived in Pennsylvania.
Place of birth for U.S.-born residents:
- This state: 15342
- Northeast: 1411
- Midwest: 272
- South: 437
- West: 196
Median price asked for vacant for-sale houses in 2000: $68,000
Percentage of households with unmarried partners: 3.9%
Likely homosexual households (counted as self-reported same-sex unmarried-partner households)
- Lesbian couples: 0.1% of all households
- Gay men: 0.1% of all households
People in group quarters in Lower Southampton township, Pennsylvania:
- 135 people in nursing homes
- 11 people in religious group quarters
- 5 people in homes for the mentally retarded
Housing units in structures:
- One, detached: 5,369
- One, attached: 479
- Two: 97
- 3 or 4: 68
- 5 to 9: 349
- 10 to 19: 187
- 20 to 49: 242
- 50 or more: 178
- Mobile homes: 357
- Boats, RVs, vans, etc.: 7
Median worth of mobile homes: $28,900
Housing units in Lower Southampton township with a mortgage: 3,493 (268 second mortgage, 656 home equity loan, 5 both second mortgage and home equity loan)
Houses without a mortgage: 1,754
- Construction (16%)
- Professional, scientific, and technical services (6%)
- Finance and insurance (5%)
- Educational services (4%)
- Repair and maintenance (4%)
- Administrative and support and waste management services (4%)
- Health care (4%)
- Health care (17%)
- Educational services (11%)
- Finance and insurance (7%)
- Professional, scientific, and technical services (7%)
- Department and other general merchandise stores (5%)
- Accommodation and food services (4%)
- Food and beverage stores (4%)
- Electrical equipment mechanics and other installation, maintenance, and repair occupations including supervisors (6%)
- Other management occupations except farmers and farm managers (6%)
- Other sales and related workers including supervisors (6%)
- Sales representatives, services, wholesale and manufacturing (6%)
- Computer specialists (6%)
- Retail sales workers except cashiers (5%)
- Material recording, scheduling, dispatching, and distributing workers (4%)
- Other office and administrative support workers including supervisors (9%)
- Secretaries and administrative assistants (7%)
- Registered nurses (5%)
- Other sales and related workers including supervisors (4%)
- Preschool, kindergarten, elementary and middle school teachers (4%)
- Bookkeeping, accounting, and auditing clerks (4%)
- Cashiers (4%)
Most common first ancestries reported in Lower Southampton township:
- German (21.0%)
- Irish (18.1%)
- Italian (15.3%)
- English (7.1%)
- Polish (6.1%)
- United States or American (5.7%)
- Russian (5.4%)
Most common places of birth for the foreign-born residents:
- Ukraine (23%)
- Russia (22%)
- Germany (9%)
- Italy (6%)
- Philippines (6%)
- China, excluding Hong Kong and Taiwan (4%)
- Belarus (3%)
Means of transportation to work:
- Drove a car alone: 8,014 (80%)
- Carpooled: 1,003 (10%)
- Bus or trolley bus: 54 (1%)
- Railroad: 253 (3%)
- Taxi: 15 (0%)
- Motorcycle: 7 (0%)
- Bicycle: 29 (0%)
- Walked: 182 (2%)
- Other means: 17 (0%)
- Worked at home: 402 (4%)
Most commonly used house heating fuel:
- Fuel oil, kerosene, etc. (50%)
- Utility gas (30%)
- Electricity (16%)
- Bottled, tank, or LP gas (3%)
- Other fuel (1%)
People in group quarters in Lower Southampton township, Pennsylvania:
- 135 people in nursing homes
- 11 people in religious group quarters
- 5 people in homes for the mentally retarded
90.0% of residents of Lower Southampton township speak English at home.
1.5% of residents speak Spanish at home (69% speak English very well, 12% speak English well, 18% speak English not well).
7.1% of residents speak other Indo-European language at home (59% speak English very well, 32% speak English well, 9% speak English not well).
1.1% of residents speak Asian or Pacific Island language at home (80% speak English very well, 20% speak English well).
0.3% of residents speak other language at home (67% speak English very well, 33% speak English well).
Household type by relationship:
Households: 19,124- In family households: 17,181 (4,257 male householders, 1,222 female householders)
4,595 spouses, 6,028 children (5,604 natural, 115 adopted, 309 stepchildren), 305 grandchildren, 119 brothers or sisters, 129 parents, 304 other relatives, 222 non-relatives
- In nonfamily households: 1,943 (877 male householders (728 living alone)), 795 female householders (696 living alone)), 271 nonrelatives
- In group quarters: 152 (136 institutionalized population)
Size of family households: 2,164 2-persons, 1,391 3-persons, 1,175 4-persons, 534 5-persons, 185 6-persons, 30 7-or-more-persons,
Size of nonfamily households: 1,424 1-person, 241 2-persons, 7 4-persons,
3,528 married couples with children.
572 single-parent households (145 men, 427 women).
Private vs. public school enrollment:
Students in private schools in grades 1 to 8 (elementary and middle school): 543
| Here: | 27.4% |
| Pennsylvania: | 16.0% |
Students in private schools in grades 9 to 12 (high school): 241
| Here: | 20.3% |
| Pennsylvania: | 13.1% |
Students in private undergraduate colleges: 225
| Here: | 28.1% |
| Pennsylvania: | 37.3% |