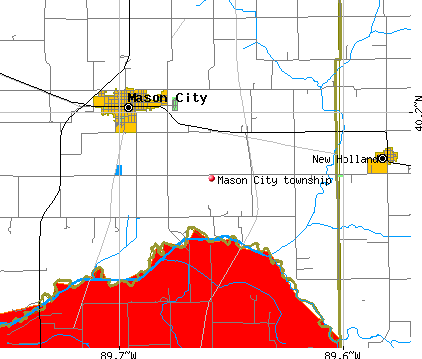
Mason City township, Mason County, Illinois (IL) detailed profile
Number of foreign born residents: 0 (36% naturalized citizens)
| Mason City township: | 0.5% |
| Whole state: | 12.3% |
62% of Mason City township residents lived in the same house 5 years ago.
Out of people who lived in different houses, 65% lived in this county.
Out of people who lived in different counties, 81% lived in Illinois.
Place of birth for U.S.-born residents:
- This state: 2503
- Northeast: 24
- Midwest: 143
- South: 124
- West: 65
Median price asked for vacant for-sale houses in 2000: $48,000
Percentage of households with unmarried partners: 4.5%
Likely homosexual households (counted as self-reported same-sex unmarried-partner households)
- Lesbian couples: 0.3% of all households
- Gay men: 0.0% of all households
79 people in nursing homes
5 people in homes for the mentally retarded
Housing units in structures:
- One, detached: 962
- One, attached: 13
- Two: 45
- 3 or 4: 49
- 5 to 9: 39
- 10 to 19: 2
- Mobile homes: 121
Median worth of mobile homes: $23,300
Housing units in Mason City township with a mortgage: 395 (30 second mortgage, 37 home equity loan, 0 both second mortgage and home equity loan)
Houses without a mortgage: 361
- Machinery (12%)
- Public administration (11%)
- Construction (11%)
- Truck transportation (7%)
- Food (5%)
- Agriculture, forestry, fishing and hunting (5%)
- Educational services (4%)
- Health care (16%)
- Public administration (14%)
- Educational services (10%)
- Finance and insurance (8%)
- Accommodation and food services (6%)
- Department and other general merchandise stores (5%)
- Food and beverage stores (4%)
- Driver/sales workers and truck drivers (11%)
- Metal workers and plastic workers (8%)
- Other production occupations including supervisors (7%)
- Laborers and material movers, hand (6%)
- Other sales and related workers including supervisors (4%)
- Material recording, scheduling, dispatching, and distributing workers (3%)
- Law enforcement workers including supervisors (3%)
- Secretaries and administrative assistants (10%)
- Other office and administrative support workers including supervisors (8%)
- Health technologists and technicians (6%)
- Preschool, kindergarten, elementary and middle school teachers (5%)
- Bookkeeping, accounting, and auditing clerks (4%)
- Other sales and related workers including supervisors (4%)
- Nursing, psychiatric, and home health aides (4%)
Most common first ancestries reported in Mason City township:
- German (36.5%)
- United States or American (18.6%)
- English (11.3%)
- Irish (9.9%)
- Scotch-Irish (2.2%)
- Swedish (2.1%)
- Dutch (2.1%)
Most common places of birth for the foreign-born residents:
- Germany (64%)
- Ireland (36%)
Means of transportation to work:
- Drove a car alone: 1,023 (78%)
- Carpooled: 232 (18%)
- Walked: 13 (1%)
- Other means: 7 (1%)
- Worked at home: 40 (3%)
Most commonly used house heating fuel:
- Utility gas (79%)
- Electricity (17%)
- Bottled, tank, or LP gas (3%)
79 people in nursing homes
5 people in homes for the mentally retarded
98.1% of residents of Mason City township speak English at home.
0.9% of residents speak Spanish at home (100% speak English very well).
0.8% of residents speak other Indo-European language at home (18% speak English very well, 32% speak English well, 50% speak English not well).
0.2% of residents speak Asian or Pacific Island language at home (100% speak English very well).
Household type by relationship:
Households: 2,795- In family households: 2,397 (642 male householders, 144 female householders)
621 spouses, 863 children (814 natural, 4 adopted, 45 stepchildren), 43 grandchildren, 0 brothers or sisters, 3 parents, 11 other relatives, 70 non-relatives
- In nonfamily households: 398 (126 male householders (115 living alone)), 250 female householders (236 living alone)), 22 nonrelatives
- In group quarters: 89 (85 institutionalized population)
Size of family households: 358 2-persons, 153 3-persons, 175 4-persons, 69 5-persons, 25 6-persons, 6 7-or-more-persons,
Size of nonfamily households: 351 1-person, 25 2-persons,
508 married couples with children.
153 single-parent households (31 men, 122 women).
Private vs. public school enrollment:
Students in private schools in grades 1 to 8 (elementary and middle school): 0
| Here: | 0.0% |
| Illinois: | 13.4% |
Students in private schools in grades 9 to 12 (high school): 0
| Here: | 0.0% |
| Illinois: | 11.1% |
Students in private undergraduate colleges: 0
| Here: | 0.0% |
| Illinois: | 25.8% |