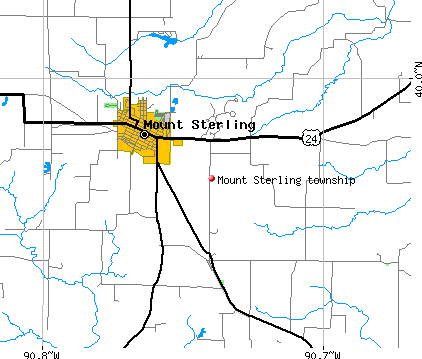
Mount Sterling township, Brown County, Illinois (IL) detailed profile
Number of foreign born residents: 2 (7% naturalized citizens)
| Mount Sterling township: | 2.3% |
| Whole state: | 12.3% |
47% of Mount Sterling township residents lived in the same house 5 years ago.
Out of people who lived in different houses, 25% lived in this county.
Out of people who lived in different counties, 76% lived in Illinois.
Place of birth for U.S.-born residents:
- This state: 3829
- Northeast: 54
- Midwest: 294
- South: 287
- West: 66
Median price asked for vacant for-sale houses in 2000: $26,300
Percentage of households with unmarried partners: 4.7%
Likely homosexual households (counted as self-reported same-sex unmarried-partner households)
- Lesbian couples: 0.1% of all households
- Gay men: 0.1% of all households
1,912 people in state prisons
60 people in nursing homes
Housing units in structures:
- One, detached: 1,014
- One, attached: 4
- Two: 37
- 3 or 4: 58
- 5 to 9: 46
- 10 to 19: 48
- 20 to 49: 4
- Mobile homes: 96
Median worth of mobile homes: $22,800
Housing units in Mount Sterling township with a mortgage: 329 (8 second mortgage, 0 home equity loan, 4 both second mortgage and home equity loan)
Houses without a mortgage: 368
- Groceries and related products merchant wholesalers (13%)
- Public administration (13%)
- Agriculture, forestry, fishing and hunting (9%)
- Truck transportation (8%)
- Food (7%)
- Construction (6%)
- Religious, grantmaking, civic, professional, and similar organizations (4%)
- Health care (17%)
- Educational services (16%)
- Groceries and related products merchant wholesalers (12%)
- Public administration (7%)
- Accommodation and food services (6%)
- Food and beverage stores (5%)
- Religious, grantmaking, civic, professional, and similar organizations (4%)
- Driver/sales workers and truck drivers (11%)
- Law enforcement workers including supervisors (8%)
- Laborers and material movers, hand (8%)
- Other production occupations including supervisors (6%)
- Farmers and farm managers (6%)
- Other sales and related workers including supervisors (4%)
- Electrical equipment mechanics and other installation, maintenance, and repair occupations including supervisors (4%)
- Secretaries and administrative assistants (13%)
- Other office and administrative support workers including supervisors (7%)
- Preschool, kindergarten, elementary and middle school teachers (6%)
- Cooks and food preparation workers (6%)
- Health technologists and technicians (6%)
- Other management occupations except farmers and farm managers (4%)
- Financial clerks except bookkeeping, accounting, and auditing clerks (4%)
Most common first ancestries reported in Mount Sterling township:
- German (32.0%)
- English (19.0%)
- United States or American (18.4%)
- Irish (13.3%)
- Scotch-Irish (2.3%)
- Scottish (2.0%)
- French (except Basque) (1.5%)
Most common places of birth for the foreign-born residents:
- Mexico (73%)
- Thailand (9%)
- Yugoslavia (6%)
- Germany (5%)
- Colombia (5%)
- Poland (3%)
Means of transportation to work:
- Drove a car alone: 1,076 (79%)
- Carpooled: 175 (13%)
- Walked: 36 (3%)
- Other means: 19 (1%)
- Worked at home: 50 (4%)
Most commonly used house heating fuel:
- Utility gas (71%)
- Electricity (18%)
- Bottled, tank, or LP gas (9%)
- Fuel oil, kerosene, etc. (1%)
- Wood (1%)
1,912 people in state prisons
60 people in nursing homes
94.2% of residents of Mount Sterling township speak English at home.
5.0% of residents speak Spanish at home (82% speak English very well, 11% speak English well, 7% speak English not well).
0.4% of residents speak other Indo-European language at home (100% speak English very well).
0.3% of residents speak Asian or Pacific Island language at home (100% speak English very well).
Household type by relationship:
Households: 2,708- In family households: 2,208 (610 male householders, 129 female householders)
623 spouses, 776 children (718 natural, 17 adopted, 41 stepchildren), 35 grandchildren, 0 brothers or sisters, 5 parents, 7 other relatives, 23 non-relatives
- In nonfamily households: 500 (218 male householders (190 living alone)), 235 female householders (219 living alone)), 47 nonrelatives
- In group quarters: 1,968 (all institutionalized)
Size of family households: 346 2-persons, 167 3-persons, 135 4-persons, 55 5-persons, 36 6-persons,
Size of nonfamily households: 409 1-person, 40 2-persons, 4 3-persons,
450 married couples with children.
154 single-parent households (49 men, 105 women).
Private vs. public school enrollment:
Students in private schools in grades 1 to 8 (elementary and middle school): 56
| Here: | 18.6% |
| Illinois: | 13.4% |
Students in private schools in grades 9 to 12 (high school): 5
| Here: | 1.7% |
| Illinois: | 11.1% |
Students in private undergraduate colleges: 5
| Here: | 9.1% |
| Illinois: | 25.8% |