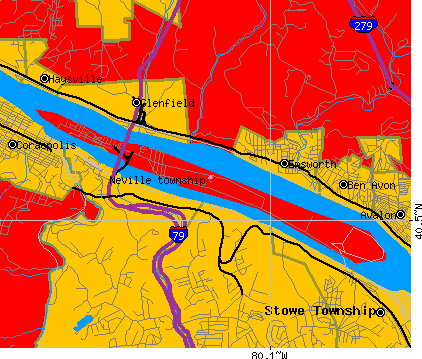
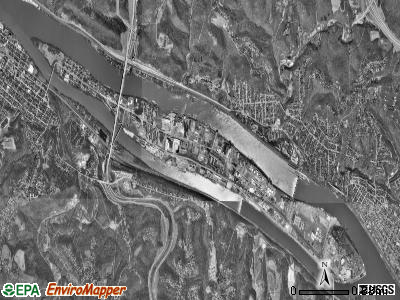
Neville township, Allegheny County, Pennsylvania (PA) detailed profile
Number of foreign born residents: 1 (75% naturalized citizens)
| Neville township: | 1.3% |
| Whole state: | 4.1% |
63% of Neville township residents lived in the same house 5 years ago.
Out of people who lived in different houses, 77% lived in this county.
Out of people who lived in different counties, 41% lived in Pennsylvania.
Place of birth for U.S.-born residents:
- This state: 1056
- Northeast: 19
- Midwest: 53
- South: 54
- West: 24
Median price asked for vacant for-sale houses in 2000: $60,000
Percentage of households with unmarried partners: 4.6%
Likely homosexual households (counted as self-reported same-sex unmarried-partner households)
- Lesbian couples: 0.2% of all households
- Gay men: 0.0% of all households
Housing units in structures:
- One, detached: 367
- One, attached: 15
- Two: 44
- 3 or 4: 200
- 5 to 9: 20
- Mobile homes: 28
Median worth of mobile homes: $9,999
Housing units in Neville township with a mortgage: 164 (8 second mortgage, 25 home equity loan, 0 both second mortgage and home equity loan)
Houses without a mortgage: 119
- Construction (10%)
- Public administration (6%)
- Arts, entertainment, and recreation (6%)
- Metal and metal products (6%)
- Truck transportation (6%)
- Finance and insurance (4%)
- Professional, scientific, and technical services (4%)
- Accommodation and food services (12%)
- Health care (9%)
- Finance and insurance (9%)
- Department and other general merchandise stores (6%)
- Administrative and support and waste management services (6%)
- Professional, scientific, and technical services (5%)
- Public administration (5%)
- Driver/sales workers and truck drivers (11%)
- Building and grounds cleaning and maintenance occupations (6%)
- Metal workers and plastic workers (5%)
- Material recording, scheduling, dispatching, and distributing workers (4%)
- Other production occupations including supervisors (4%)
- Laborers and material movers, hand (4%)
- Other office and administrative support workers including supervisors (4%)
- Other office and administrative support workers including supervisors (12%)
- Secretaries and administrative assistants (7%)
- Cashiers (6%)
- Information and record clerks except customer service representatives (5%)
- Retail sales workers except cashiers (4%)
- Food and beverage serving workers except waiters/waitresses (3%)
- Waiters and waitresses (3%)
Most common first ancestries reported in Neville township:
- German (26.6%)
- Irish (13.4%)
- Italian (12.9%)
- English (8.1%)
- Polish (6.1%)
- United States or American (6.1%)
- Scotch-Irish (4.9%)
Most common places of birth for the foreign-born residents:
- Italy (31%)
- Panama (25%)
- United Kingdom (19%)
- Germany (13%)
- Poland (13%)
Means of transportation to work:
- Drove a car alone: 461 (76%)
- Carpooled: 49 (8%)
- Bus or trolley bus: 45 (7%)
- Bicycle: 2 (0%)
- Walked: 31 (5%)
- Other means: 12 (2%)
- Worked at home: 4 (1%)
Most commonly used house heating fuel:
- Utility gas (93%)
- Fuel oil, kerosene, etc. (2%)
- Other fuel (2%)
- Electricity (2%)
- Bottled, tank, or LP gas (1%)
96.1% of residents of Neville township speak English at home.
0.7% of residents speak Spanish at home (75% speak English very well, 25% speak English not well).
2.9% of residents speak other Indo-European language at home (62% speak English very well, 24% speak English well, 15% speak English not well).
0.3% of residents speak other language at home (100% speak English very well).
Household type by relationship:
Households: 1,229- In family households: 853 (203 male householders, 102 female householders)
202 spouses, 266 children (254 natural, 0 adopted, 12 stepchildren), 17 grandchildren, 21 brothers or sisters, 14 parents, 9 other relatives, 19 non-relatives
- In nonfamily households: 376 (165 male householders (138 living alone)), 174 female householders (164 living alone)), 37 nonrelatives
Size of family households: 170 2-persons, 67 3-persons, 41 4-persons, 15 5-persons, 6 6-persons, 6 7-or-more-persons,
Size of nonfamily households: 302 1-person, 36 2-persons, 1 3-persons,
139 married couples with children.
69 single-parent households (17 men, 52 women).
Private vs. public school enrollment:
Students in private schools in grades 1 to 8 (elementary and middle school): 24
| Here: | 25.8% |
| Pennsylvania: | 16.0% |
Students in private schools in grades 9 to 12 (high school): 5
| Here: | 14.7% |
| Pennsylvania: | 13.1% |
Students in private undergraduate colleges: 7
| Here: | 29.2% |
| Pennsylvania: | 37.3% |