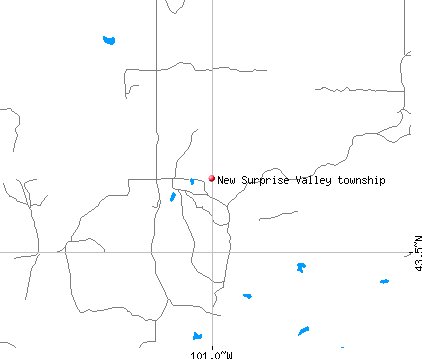
New Surprise Valley township, Mellette County, South Dakota (SD) detailed profile
Number of foreign born residents: 6,725 (11% naturalized citizens)
| New Surprise Valley township: | 6725.0% |
| Whole state: | 1.8% |
54% of New Surprise Valley township residents lived in the same house 5 years ago.
Out of people who lived in different houses, 25% lived in this county.
Out of people who lived in different counties, 35% lived in South Dakota.
Place of birth for U.S.-born residents:
- This state: 2316
- Northeast: 633
- Midwest: 165
- South: 806
- West: 115
Percentage of households with unmarried partners: 0.0%
No gay or lesbian households reported
Housing units in structures:
- One, detached: 860
- One, attached: 28
- Two: 10
- 3 or 4: 14
- Mobile homes: 106
Median worth of mobile homes: $47,000
Housing units in New Surprise Valley township with a mortgage: 509 (41 second mortgage, 64 home equity loan, 9 both second mortgage and home equity loan)
Houses without a mortgage: 139
- Educational services (14%)
- Construction (9%)
- Food and beverage stores (8%)
- Agriculture, forestry, fishing and hunting (8%)
- Accommodation and food services (6%)
- Administrative and support and waste management services (6%)
- Real estate and rental and leasing (5%)
- Educational services (25%)
- Health care (13%)
- Accommodation and food services (11%)
- Finance and insurance (7%)
- Administrative and support and waste management services (7%)
- Agriculture, forestry, fishing and hunting (5%)
- Social assistance (3%)
- Building and grounds cleaning and maintenance occupations (14%)
- Other management occupations except farmers and farm managers (6%)
- Supervisors and other personal care and service workers except personal appearance, transportation, and child care workers (6%)
- Cooks and food preparation workers (5%)
- Farmers and farm managers (4%)
- Driver/sales workers and truck drivers (4%)
- Other production occupations including supervisors (4%)
- Secretaries and administrative assistants (9%)
- Other office and administrative support workers including supervisors (8%)
- Other food preparation and serving workers including supervisors (6%)
- Information and record clerks except customer service representatives (6%)
- Other protective service workers including supervisors (6%)
- Waiters and waitresses (5%)
- Supervisors and other personal care and service workers except personal appearance, transportation, and child care workers (4%)
Most common first ancestries reported in New Surprise Valley township:
- German (12.5%)
- Irish (11.4%)
- United States or American (8.5%)
- English (6.7%)
- African (6.4%)
- Italian (6.4%)
- Scotch-Irish (2.8%)
Most common places of birth for the foreign-born residents:
- Mexico (65%)
- United Kingdom (9%)
- Jamaica (7%)
- Haiti (4%)
- Nigeria (3%)
- Venezuela (3%)
- Sweden (2%)
Means of transportation to work:
- Drove a car alone: 1,146 (57%)
- Carpooled: 289 (14%)
- Bus or trolley bus: 10 (0%)
- Motorcycle: 11 (1%)
- Walked: 333 (16%)
- Other means: 11 (1%)
- Worked at home: 225 (11%)
Most commonly used house heating fuel:
- Fuel oil, kerosene, etc. (36%)
- Bottled, tank, or LP gas (20%)
- Electricity (18%)
- Utility gas (18%)
- Wood (6%)
- Coal or coke (3%)
79.8% of residents of New Surprise Valley township speak English at home.
11.0% of residents speak Spanish at home (41% speak English very well, 33% speak English well, 12% speak English not well, 14% don't speak English at all).
7.5% of residents speak other Indo-European language at home (62% speak English very well, 37% speak English well, 1% speak English not well).
1.2% of residents speak Asian or Pacific Island language at home (44% speak English very well, 56% speak English well).
0.5% of residents speak other language at home (40% speak English very well, 60% speak English well).
Household type by relationship:
Households: 3,006- In family households: 2,740 (701 male householders, 120 female householders)
753 spouses, 1,036 children (956 natural, 11 adopted, 69 stepchildren), 24 grandchildren, 15 brothers or sisters, 0 parents, 32 other relatives, 59 non-relatives
- In nonfamily households: 266 (83 male householders (57 living alone)), 111 female householders (97 living alone)), 72 nonrelatives
- In group quarters: 1,313 (0 institutionalized population)
Size of family households: 309 2-persons, 169 3-persons, 168 4-persons, 87 5-persons, 53 6-persons, 35 7-or-more-persons,
Size of nonfamily households: 154 1-person, 31 2-persons, 5 3-persons, 2 5-persons, 2 7-or-more-persons,
1 married couples with children.
0 single-parent households (0 men, 0 women).
Private vs. public school enrollment:
Students in private schools in grades 1 to 8 (elementary and middle school): 94
| Here: | 21.0% |
| South Dakota: | 8.0% |
Students in private schools in grades 9 to 12 (high school): 3
| Here: | 2.1% |
| South Dakota: | 5.6% |
Students in private undergraduate colleges: 755
| Here: | 57.2% |
| South Dakota: | 17.8% |