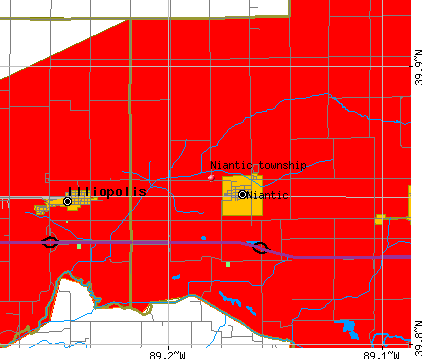
Niantic township, Macon County, Illinois (IL) detailed profile
Number of foreign born residents: 0 (0% naturalized citizens)
| Niantic township: | 0.2% |
| Whole state: | 12.3% |
56% of Niantic township residents lived in the same house 5 years ago.
Out of people who lived in different houses, 71% lived in this county.
Out of people who lived in different counties, 54% lived in Illinois.
Place of birth for U.S.-born residents:
- This state: 710
- Northeast: 12
- Midwest: 66
- South: 77
- West: 8
Median price asked for vacant for-sale houses in 2000: $55,000
Percentage of households with unmarried partners: 4.3%
No gay or lesbian households reported
Housing units in structures:
- One, detached: 309
- One, attached: 2
- 3 or 4: 2
- 5 to 9: 5
- 10 to 19: 10
- Mobile homes: 34
Median worth of mobile homes: $28,800
Housing units in Niantic township with a mortgage: 146 (20 second mortgage, 12 home equity loan, 0 both second mortgage and home equity loan)
Houses without a mortgage: 84
- Agriculture, forestry, fishing and hunting (12%)
- Construction (11%)
- Machinery (8%)
- Food (7%)
- Educational services (5%)
- Rail transportation (5%)
- Plastics and rubber products (4%)
- Educational services (17%)
- Health care (10%)
- Accommodation and food services (10%)
- Finance and insurance (9%)
- Department and other general merchandise stores (7%)
- Professional, scientific, and technical services (6%)
- Food and beverage stores (4%)
- Farmers and farm managers (8%)
- Other production occupations including supervisors (8%)
- Vehicle and mobile equipment mechanics, installers, and repairers (8%)
- Construction trades workers except carpenters, electricians, painters, plumbers, and construction laborers (5%)
- Metal workers and plastic workers (5%)
- Building and grounds cleaning and maintenance occupations (5%)
- Electrical equipment mechanics and other installation, maintenance, and repair occupations including supervisors (5%)
- Secretaries and administrative assistants (12%)
- Cashiers (8%)
- Waiters and waitresses (5%)
- Building and grounds cleaning and maintenance occupations (4%)
- Preschool, kindergarten, elementary and middle school teachers (4%)
- Retail sales workers except cashiers (4%)
- Other office and administrative support workers including supervisors (4%)
Most common first ancestries reported in Niantic township:
- United States or American (24.4%)
- German (22.0%)
- English (15.4%)
- Irish (11.2%)
- European (4.1%)
- Italian (3.6%)
- French (except Basque) (2.5%)
Most common places of birth for the foreign-born residents:
- Philippines (100%)
Means of transportation to work:
- Drove a car alone: 319 (82%)
- Carpooled: 39 (10%)
- Bus or trolley bus: 2 (1%)
- Streetcar or trolley car: 1 (0%)
- Walked: 4 (1%)
- Other means: 6 (2%)
- Worked at home: 18 (5%)
Most commonly used house heating fuel:
- Utility gas (79%)
- Bottled, tank, or LP gas (12%)
- Electricity (6%)
- Fuel oil, kerosene, etc. (3%)
99.1% of residents of Niantic township speak English at home.
0.5% of residents speak Spanish at home (100% speak English very well).
0.4% of residents speak other Indo-European language at home (100% speak English very well).
Household type by relationship:
Households: 879- In family households: 807 (223 male householders, 29 female householders)
215 spouses, 296 children (248 natural, 17 adopted, 31 stepchildren), 12 grandchildren, 5 brothers or sisters, 4 parents, 7 other relatives, 16 non-relatives
- In nonfamily households: 72 (41 male householders (34 living alone)), 23 female householders (21 living alone)), 8 nonrelatives
Size of family households: 113 2-persons, 35 3-persons, 51 4-persons, 32 5-persons, 16 6-persons, 5 7-or-more-persons,
Size of nonfamily households: 55 1-person, 7 2-persons, 2 3-persons,
213 married couples with children.
35 single-parent households (14 men, 21 women).
Private vs. public school enrollment:
Students in private schools in grades 1 to 8 (elementary and middle school): 3
| Here: | 2.5% |
| Illinois: | 13.4% |
Students in private schools in grades 9 to 12 (high school): 2
| Here: | 3.9% |
| Illinois: | 11.1% |
Students in private undergraduate colleges: 6
| Here: | 14.6% |
| Illinois: | 25.8% |