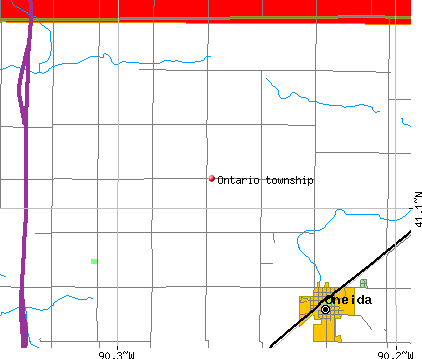
Ontario township, Knox County, Illinois (IL) detailed profile
Land area: 36.2 sq. mi.
Water area: 0.0 sq. mi.
Population: 1,047 (all rural)
| Males: 524 | |
| Females: 523 |
Occupied houses/apartments: 1,047 (810 owner occupied, 237 renter occupied)
| % of renters here: | 23% |
| State: | 33% |
Races in Ontario township:
- White Non-Hispanic: 98.1%
- American Indian and Alaska Native: 0.1%
- Asian: 0.5%
- Two or more races: 0.2%
Median age of males: 38.7
Median age of females: 39.1
Discuss Illinois on our huge forum. We have over 16 million posts!
Average household size: 2.57
| Ontario township: | 2.6 people |
| Illinois: | 2.6 people |
Average family size: 3.00
| Ontario township: | $39,553 |
| Illinois: | $56,210 |
| Here: | $439 |
| State: | $772 |
Estimated median house or condo value in 2013: $75,450 (it was $63,400 in 2000)
| : | $75,450 |
| Illinois: | $169,600 |
| Population density: 29 people per square mile | (low). |
| This township: | 4.7% |
| Whole state: | 10.7% |
Cities in this township include: Oneida.
Notable locations in this township outside city limits:
Cemeteries: Oneida Cemetery (1), Ontario Cemetery (2). Display/hide their locations on the map
66% of Ontario township residents lived in the same house 5 years ago.
Out of people who lived in different houses, 66% lived in this county.
Out of people who lived in different counties, 55% lived in Illinois.
Place of birth for U.S.-born residents:
- This state: 870
- Northeast: 18
- Midwest: 92
- South: 15
- West: 21
Percentage of households with unmarried partners: 3.9%
Likely homosexual households (counted as self-reported same-sex unmarried-partner households)
- Lesbian couples: 0.2% of all households
- Gay men: 0.0% of all households
Housing units in structures:
- One, detached: 351
- One, attached: 5
- Two: 15
- 3 or 4: 12
- 5 to 9: 8
- 10 to 19: 4
- Mobile homes: 7
Housing units in Ontario township with a mortgage: 154 (3 second mortgage, 5 home equity loan, 0 both second mortgage and home equity loan)
Houses without a mortgage: 118
- Agriculture, forestry, fishing and hunting (12%)
- Construction (12%)
- Truck transportation (9%)
- Metal and metal products (8%)
- Educational services (7%)
- Electrical equipment, appliances, and components (5%)
- Rail transportation (5%)
- Educational services (22%)
- Health care (9%)
- Food and beverage stores (7%)
- Finance and insurance (6%)
- Accommodation and food services (5%)
- Department and other general merchandise stores (5%)
- Publishing, and motion picture and sound recording industries (5%)
- Farmers and farm managers (11%)
- Other production occupations including supervisors (9%)
- Driver/sales workers and truck drivers (9%)
- Metal workers and plastic workers (8%)
- Electrical equipment mechanics and other installation, maintenance, and repair occupations including supervisors (6%)
- Vehicle and mobile equipment mechanics, installers, and repairers (5%)
- Construction trades workers except carpenters, electricians, painters, plumbers, and construction laborers (4%)
- Preschool, kindergarten, elementary and middle school teachers (12%)
- Secretaries and administrative assistants (7%)
- Other sales and related workers including supervisors (6%)
- Cooks and food preparation workers (5%)
- Other management occupations except farmers and farm managers (4%)
- Retail sales workers except cashiers (4%)
- Secondary school teachers (4%)
Most common first ancestries reported in Ontario township:
- Swedish (31.2%)
- German (18.3%)
- Irish (11.7%)
- English (9.5%)
- United States or American (6.8%)
- Dutch (3.5%)
- Scottish (2.7%)
Means of transportation to work:
- Drove a car alone: 427 (83%)
- Carpooled: 31 (6%)
- Walked: 11 (2%)
- Worked at home: 44 (9%)
Most commonly used house heating fuel:
- Utility gas (68%)
- Electricity (14%)
- Bottled, tank, or LP gas (12%)
- Fuel oil, kerosene, etc. (4%)
- Wood (1%)
- Other fuel (1%)
94.9% of residents of Ontario township speak English at home.
2.3% of residents speak Spanish at home (100% speak English very well).
2.4% of residents speak other Indo-European language at home (100% speak English very well).
0.3% of residents speak Asian or Pacific Island language at home (67% speak English very well, 33% speak English not well).
Household type by relationship:
Households: 1,016- In family households: 912 (265 male householders, 48 female householders)
244 spouses, 310 children (286 natural, 17 adopted, 7 stepchildren), 15 grandchildren, 3 brothers or sisters, 3 parents, 17 other relatives, 7 non-relatives
- In nonfamily households: 104 (37 male householders (35 living alone)), 52 female householders (39 living alone)), 15 nonrelatives
Size of family households: 153 2-persons, 73 3-persons, 43 4-persons, 38 5-persons, 6 6-persons,
Size of nonfamily households: 74 1-person, 15 2-persons,
216 married couples with children.
44 single-parent households (13 men, 31 women).
Private vs. public school enrollment:
Students in private schools in grades 1 to 8 (elementary and middle school): 0
| Here: | 0.0% |
| Illinois: | 13.4% |
Students in private schools in grades 9 to 12 (high school): 0
| Here: | 0.0% |
| Illinois: | 11.1% |
Students in private undergraduate colleges: 8
| Here: | 33.3% |
| Illinois: | 25.8% |