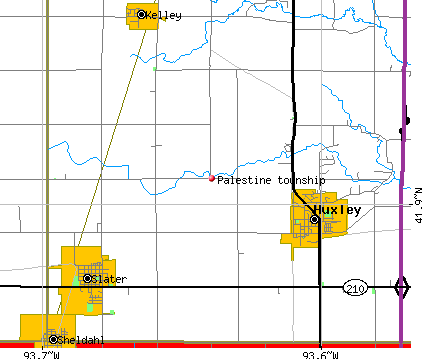
Palestine township, Story County, Iowa (IA) detailed profile
Number of foreign born residents: 0 (0% naturalized citizens)
| Palestine township: | 0.1% |
| Whole state: | 3.1% |
67% of Palestine township residents lived in the same house 5 years ago.
Out of people who lived in different houses, 90% lived in this county.
Out of people who lived in different counties, 39% lived in Iowa.
Place of birth for U.S.-born residents:
- This state: 486
- Northeast: 22
- Midwest: 42
- South: 43
- West: 17
Median price asked for vacant for-sale houses in 2000: $30,000
Percentage of households with unmarried partners: 4.8%
Likely homosexual households (counted as self-reported same-sex unmarried-partner households)
- Lesbian couples: 0.2% of all households
- Gay men: 0.0% of all households
22 people in other noninstitutional group quarters
Housing units in structures:
- One, detached: 162
- One, attached: 7
- Two: 15
- 3 or 4: 3
- 5 to 9: 16
- 10 to 19: 2
- 20 to 49: 2
- Mobile homes: 73
- Boats, RVs, vans, etc.: 3
Median worth of mobile homes: $29,800
Housing units in Palestine township with a mortgage: 43 (6 second mortgage, 2 home equity loan, 0 both second mortgage and home equity loan)
Houses without a mortgage: 63
- Construction (39%)
- Agriculture, forestry, fishing and hunting (18%)
- Truck transportation (7%)
- Professional, scientific, and technical services (7%)
- Metal and metal products (5%)
- Accommodation and food services (4%)
- Administrative and support and waste management services (3%)
- Educational services (19%)
- Health care (18%)
- Construction (10%)
- Finance and insurance (7%)
- Gasoline stations (5%)
- Administrative and support and waste management services (5%)
- Food and beverage stores (4%)
- Farmers and farm managers (17%)
- Construction laborers (15%)
- Driver/sales workers and truck drivers (9%)
- Construction trades workers except carpenters, electricians, painters, plumbers, and construction laborers (7%)
- Building and grounds cleaning and maintenance occupations (5%)
- Other financial specialists (4%)
- Cooks and food preparation workers (4%)
- Counselors, social workers, and other community and social service specialists (10%)
- Building and grounds cleaning and maintenance occupations (7%)
- Bookkeeping, accounting, and auditing clerks (7%)
- Material recording, scheduling, dispatching, and distributing workers (7%)
- Health technologists and technicians (6%)
- Nursing, psychiatric, and home health aides (6%)
- Information and record clerks except customer service representatives (6%)
Most common first ancestries reported in Palestine township:
- United States or American (32.9%)
- German (10.4%)
- Irish (9.9%)
- Scottish (7.1%)
- French (except Basque) (4.7%)
- English (3.1%)
- British (1.6%)
Most common places of birth for the foreign-born residents:
- Mexico (100%)
Means of transportation to work:
- Drove a car alone: 156 (73%)
- Carpooled: 32 (15%)
- Walked: 6 (3%)
- Worked at home: 21 (10%)
Most commonly used house heating fuel:
- Electricity (41%)
- Utility gas (34%)
- Bottled, tank, or LP gas (19%)
- Wood (5%)
22 people in other noninstitutional group quarters
98.5% of residents of Palestine township speak English at home.
1.5% of residents speak Spanish at home (100% speak English very well).
Household type by relationship:
Households: 599- In family households: 504 (135 male householders, 33 female householders)
136 spouses, 192 children (170 natural, 9 adopted, 13 stepchildren), 7 grandchildren, 0 brothers or sisters, 0 parents, 0 other relatives, 1 non-relatives
- In nonfamily households: 95 (42 male householders (33 living alone)), 42 female householders (41 living alone)), 11 nonrelatives
- In group quarters: 22 (all institutionalized)
Size of family households: 77 2-persons, 46 3-persons, 33 4-persons, 7 5-persons, 5 7-or-more-persons,
Size of nonfamily households: 74 1-person, 10 2-persons,
991 married couples with children.
204 single-parent households (64 men, 140 women).
Private vs. public school enrollment:
Students in private schools in grades 1 to 8 (elementary and middle school): 17
| Here: | 29.3% |
| Iowa: | 10.8% |
Students in private schools in grades 9 to 12 (high school): 0
| Here: | 0.0% |
| Iowa: | 7.1% |
Students in private undergraduate colleges: 0
| Here: | 0.0% |
| Iowa: | 25.4% |