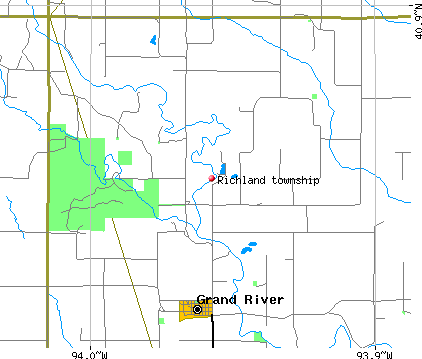
Richland township, Decatur County, Iowa (IA) detailed profile
Number of foreign born residents: 2 (38% naturalized citizens)
| Richland township: | 2.0% |
| Whole state: | 3.1% |
69% of Richland township residents lived in the same house 5 years ago.
Out of people who lived in different houses, 40% lived in this county.
Out of people who lived in different counties, 23% lived in Iowa.
Place of birth for U.S.-born residents:
- This state: 800
- Northeast: 6
- Midwest: 20
- South: 689
- West: 15
Median price asked for vacant for-sale houses in 2000: $20,800
Percentage of households with unmarried partners: 2.9%
No gay or lesbian households reported
Housing units in structures:
- One, detached: 567
- One, attached: 7
- 3 or 4: 2
- 5 to 9: 2
- Mobile homes: 123
- Boats, RVs, vans, etc.: 2
Median worth of mobile homes: $9,999
Housing units in Richland township with a mortgage: 121 (2 second mortgage, 4 home equity loan, 0 both second mortgage and home equity loan)
Houses without a mortgage: 203
- Agriculture, forestry, fishing and hunting (26%)
- Machinery (7%)
- Truck transportation (7%)
- Food (6%)
- Motor vehicle and parts dealers (6%)
- Utilities (6%)
- Apparel (4%)
- Administrative and support and waste management services (14%)
- Health care (12%)
- Electrical equipment, appliances, and components (8%)
- Agriculture, forestry, fishing and hunting (7%)
- Food (7%)
- Metal and metal products (7%)
- Transportation equipment (5%)
- Farmers and farm managers (19%)
- Driver/sales workers and truck drivers (8%)
- Retail sales workers except cashiers (7%)
- Material recording, scheduling, dispatching, and distributing workers (7%)
- Agricultural workers including supervisors (7%)
- Electrical equipment mechanics and other installation, maintenance, and repair occupations including supervisors (6%)
- Material moving workers except supervisors and laborers and material movers, hand (6%)
- Information and record clerks except customer service representatives (12%)
- Other production occupations including supervisors (12%)
- Assemblers and fabricators (8%)
- Farmers and farm managers (7%)
- Registered nurses (5%)
- Cooks and food preparation workers (5%)
- Sales representatives, services, wholesale and manufacturing (5%)
Most common first ancestries reported in Richland township:
- United States or American (33.0%)
- English (12.7%)
- Irish (10.2%)
- German (4.0%)
- French (except Basque) (3.2%)
- European (2.8%)
- Scotch-Irish (1.2%)
Most common places of birth for the foreign-born residents:
- Japan (38%)
- Philippines (38%)
- Mexico (25%)
Means of transportation to work:
- Drove a car alone: 495 (81%)
- Carpooled: 73 (12%)
- Bicycle: 10 (2%)
- Walked: 2 (0%)
- Other means: 10 (2%)
- Worked at home: 18 (3%)
Most commonly used house heating fuel:
- Electricity (35%)
- Utility gas (33%)
- Bottled, tank, or LP gas (24%)
- Wood (7%)
97.2% of residents of Richland township speak English at home.
1.7% of residents speak Spanish at home (100% speak English very well).
0.3% of residents speak other Indo-European language at home (100% speak English very well).
0.8% of residents speak Asian or Pacific Island language at home (45% speak English very well, 55% speak English well).
0.1% of residents speak other language at home (100% speak English very well).
Household type by relationship:
Households: 1,512- In family households: 1,369 (373 male householders, 77 female householders)
382 spouses, 430 children (394 natural, 3 adopted, 33 stepchildren), 45 grandchildren, 4 brothers or sisters, 11 parents, 24 other relatives, 23 non-relatives
- In nonfamily households: 143 (57 male householders (57 living alone)), 82 female householders (79 living alone)), 4 nonrelatives
- In group quarters: 32 (all institutionalized)
Size of family households: 216 2-persons, 101 3-persons, 82 4-persons, 38 5-persons, 11 6-persons, 2 7-or-more-persons,
Size of nonfamily households: 136 1-person, 3 3-persons,
77 married couples with children.
18 single-parent households (7 men, 11 women).
Private vs. public school enrollment:
Students in private schools in grades 1 to 8 (elementary and middle school): 0
| Here: | 0.0% |
| Iowa: | 10.8% |
Students in private schools in grades 9 to 12 (high school): 0
| Here: | 0.0% |
| Iowa: | 7.1% |
Students in private undergraduate colleges: 2
| Here: | 4.5% |
| Iowa: | 25.4% |