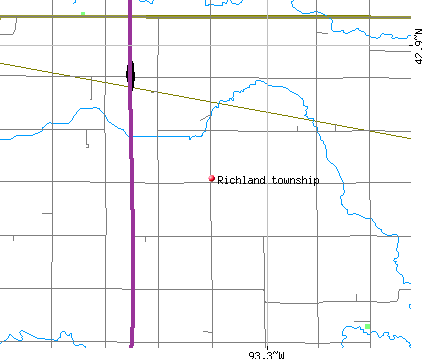
Richland township, Franklin County, Iowa (IA) detailed profile
Number of foreign born residents: 2 (60% naturalized citizens)
| Richland township: | 2.4% |
| Whole state: | 3.1% |
61% of Richland township residents lived in the same house 5 years ago.
Out of people who lived in different houses, 64% lived in this county.
Out of people who lived in different counties, 65% lived in Iowa.
Place of birth for U.S.-born residents:
- This state: 1795
- Northeast: 10
- Midwest: 146
- South: 270
- West: 28
Median price asked for vacant for-sale houses in 2000: $30,000
Percentage of households with unmarried partners: 2.5%
Likely homosexual households (counted as self-reported same-sex unmarried-partner households)
- Lesbian couples: 1.2% of all households
- Gay men: 0.0% of all households
Housing units in structures:
- One, detached: 540
- One, attached: 2
- Two: 19
- 3 or 4: 6
- Mobile homes: 376
Median worth of mobile homes: $27,300
Housing units in Richland township with a mortgage: 159 (9 second mortgage, 0 home equity loan, 2 both second mortgage and home equity loan)
Houses without a mortgage: 147
- Construction (18%)
- Public administration (7%)
- Agriculture, forestry, fishing and hunting (7%)
- Truck transportation (6%)
- Machinery (5%)
- Plastics and rubber products (4%)
- Food and beverage stores (4%)
- Educational services (14%)
- Health care (10%)
- Accommodation and food services (9%)
- Finance and insurance (6%)
- Department and other general merchandise stores (5%)
- Public administration (5%)
- Food and beverage stores (4%)
- Other production occupations including supervisors (12%)
- Driver/sales workers and truck drivers (8%)
- Vehicle and mobile equipment mechanics, installers, and repairers (7%)
- Electrical equipment mechanics and other installation, maintenance, and repair occupations including supervisors (6%)
- Material moving workers except supervisors and laborers and material movers, hand (6%)
- Laborers and material movers, hand (5%)
- Other management occupations except farmers and farm managers (5%)
- Other production occupations including supervisors (11%)
- Other office and administrative support workers including supervisors (6%)
- Bookkeeping, accounting, and auditing clerks (6%)
- Cooks and food preparation workers (6%)
- Other sales and related workers including supervisors (5%)
- Health technologists and technicians (4%)
- Waiters and waitresses (4%)
Most common first ancestries reported in Richland township:
- United States or American (33.3%)
- Irish (9.4%)
- English (4.7%)
- German (3.2%)
- Scottish (1.5%)
- African (1.2%)
- French (except Basque) (1.1%)
Most common places of birth for the foreign-born residents:
- United Kingdom (40%)
- Honduras (40%)
Means of transportation to work:
- Drove a car alone: 799 (83%)
- Carpooled: 132 (14%)
- Walked: 11 (1%)
- Other means: 5 (1%)
- Worked at home: 11 (1%)
Most commonly used house heating fuel:
- Electricity (34%)
- Utility gas (31%)
- Bottled, tank, or LP gas (31%)
- Wood (4%)
- Fuel oil, kerosene, etc. (1%)
98.5% of residents of Richland township speak English at home.
1.0% of residents speak Spanish at home (67% speak English very well, 33% speak English well).
0.5% of residents speak other Indo-European language at home (100% speak English well).
Household type by relationship:
Households: 2,255- In family households: 1,987 (494 male householders, 141 female householders)
500 spouses, 698 children (615 natural, 9 adopted, 74 stepchildren), 76 grandchildren, 8 brothers or sisters, 22 parents, 36 other relatives, 12 non-relatives
- In nonfamily households: 268 (139 male householders (115 living alone)), 96 female householders (87 living alone)), 33 nonrelatives
Size of family households: 253 2-persons, 181 3-persons, 134 4-persons, 43 5-persons, 17 6-persons, 7 7-or-more-persons,
Size of nonfamily households: 202 1-person, 30 2-persons, 3 3-persons,
49 married couples with children.
1 single-parent households (0 men, 1 women).
Private vs. public school enrollment:
Students in private schools in grades 1 to 8 (elementary and middle school): 9
| Here: | 3.4% |
| Iowa: | 10.8% |
Students in private schools in grades 9 to 12 (high school): 18
| Here: | 12.9% |
| Iowa: | 7.1% |
Students in private undergraduate colleges: 3
| Here: | 5.5% |
| Iowa: | 25.4% |