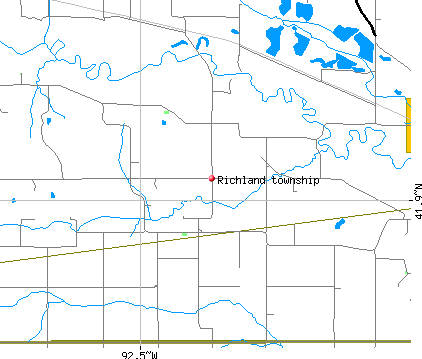
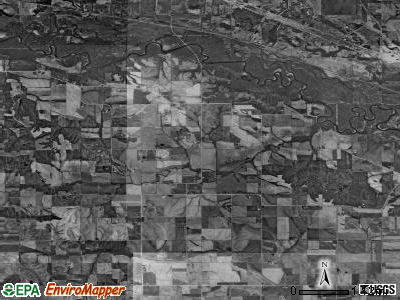
Richland township, Tama County, Iowa (IA) detailed profile
Number of foreign born residents: 2 (60% naturalized citizens)
| Richland township: | 2.0% |
| Whole state: | 3.1% |
64% of Richland township residents lived in the same house 5 years ago.
Out of people who lived in different houses, 22% lived in this county.
Out of people who lived in different counties, 50% lived in Iowa.
Place of birth for U.S.-born residents:
- This state: 319
- Northeast: 28
- Midwest: 113
- South: 96
- West: 31
Median price asked for vacant for-sale houses in 2000: $12,500
Percentage of households with unmarried partners: 6.9%
Likely homosexual households (counted as self-reported same-sex unmarried-partner households)
- Lesbian couples: 0.0% of all households
- Gay men: 1.1% of all households
Housing units in structures:
- One, detached: 233
- One, attached: 4
- Two: 2
- Mobile homes: 52
- Boats, RVs, vans, etc.: 2
Median worth of mobile homes: $31,600
Housing units in Richland township with a mortgage: 28 (4 second mortgage, 0 home equity loan, 0 both second mortgage and home equity loan)
Houses without a mortgage: 32
- Construction (18%)
- Agriculture, forestry, fishing and hunting (14%)
- Food and beverage stores (8%)
- Wood products (6%)
- Furniture and related product manufacturing (6%)
- Truck transportation (6%)
- Utilities (5%)
- Health care (16%)
- Accommodation and food services (14%)
- Arts, entertainment, and recreation (9%)
- Agriculture, forestry, fishing and hunting (8%)
- Social assistance (8%)
- Educational services (7%)
- Private households (5%)
- Farmers and farm managers (12%)
- Driver/sales workers and truck drivers (11%)
- Construction trades workers except carpenters, electricians, painters, plumbers, and construction laborers (8%)
- Material recording, scheduling, dispatching, and distributing workers (7%)
- Other production occupations including supervisors (7%)
- Laborers and material movers, hand (7%)
- Woodworkers (6%)
- Other management occupations except farmers and farm managers (8%)
- Cooks and food preparation workers (6%)
- Cashiers (6%)
- Information and record clerks except customer service representatives (6%)
- Farmers and farm managers (6%)
- Preschool, kindergarten, elementary and middle school teachers (6%)
- Building and grounds cleaning and maintenance occupations (5%)
Most common first ancestries reported in Richland township:
- United States or American (18.2%)
- German (16.8%)
- Irish (10.0%)
- English (7.0%)
- Scotch-Irish (3.8%)
- Dutch (3.3%)
- French (except Basque) (3.3%)
Most common places of birth for the foreign-born residents:
- Laos (100%)
Means of transportation to work:
- Drove a car alone: 141 (65%)
- Carpooled: 43 (20%)
- Walked: 18 (8%)
- Other means: 5 (2%)
- Worked at home: 11 (5%)
Most commonly used house heating fuel:
- Bottled, tank, or LP gas (45%)
- Wood (35%)
- Electricity (17%)
- Utility gas (1%)
- Fuel oil, kerosene, etc. (1%)
- Other fuel (1%)
- No fuel used (1%)
97.7% of residents of Richland township speak English at home.
0.4% of residents speak other Indo-European language at home (100% speak English well).
1.6% of residents speak Asian or Pacific Island language at home (44% speak English very well, 33% speak English well, 22% speak English not well).
0.4% of residents speak other language at home (100% speak English very well).
Household type by relationship:
Households: 593- In family households: 508 (132 male householders, 28 female householders)
139 spouses, 174 children (150 natural, 10 adopted, 14 stepchildren), 5 grandchildren, 5 brothers or sisters, 2 parents, 7 other relatives, 16 non-relatives
- In nonfamily households: 85 (38 male householders (26 living alone)), 33 female householders (33 living alone)), 14 nonrelatives
Size of family households: 78 2-persons, 29 3-persons, 29 4-persons, 15 5-persons, 4 6-persons, 5 7-or-more-persons,
Size of nonfamily households: 59 1-person, 9 2-persons, 3 3-persons,
63 married couples with children.
13 single-parent households (9 men, 4 women).
Private vs. public school enrollment:
Students in private schools in grades 1 to 8 (elementary and middle school): 2
| Here: | 2.4% |
| Iowa: | 10.8% |
Students in private schools in grades 9 to 12 (high school): 0
| Here: | 0.0% |
| Iowa: | 7.1% |
Students in private undergraduate colleges: 2
| Here: | 18.2% |
| Iowa: | 25.4% |