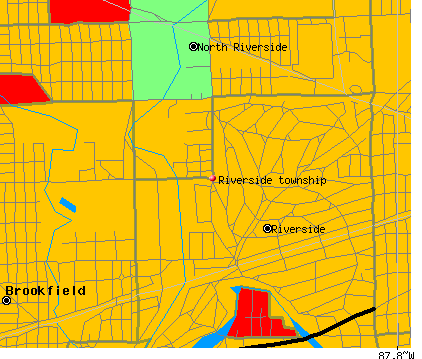
Riverside township, Cook County, Illinois (IL) detailed profile
Number of foreign born residents: 11 (56% naturalized citizens)
| Riverside township: | 10.8% |
| Whole state: | 12.3% |
70% of Riverside township residents lived in the same house 5 years ago.
Out of people who lived in different houses, 81% lived in this county.
Out of people who lived in different counties, 43% lived in Illinois.
Place of birth for U.S.-born residents:
- This state: 11874
- Northeast: 450
- Midwest: 966
- South: 316
- West: 319
Median price asked for vacant for-sale houses in 2000: $191,700
Percentage of households with unmarried partners: 3.7%
Likely homosexual households (counted as self-reported same-sex unmarried-partner households)
- Lesbian couples: 0.2% of all households
- Gay men: 0.2% of all households
548 people in nursing homes
59 people in other noninstitutional group quarters
Housing units in structures:
- One, detached: 4,657
- One, attached: 244
- Two: 237
- 3 or 4: 331
- 5 to 9: 576
- 10 to 19: 191
- 20 to 49: 278
- 50 or more: 99
- Mobile homes: 11
Median worth of mobile homes: $275,000
Housing units in Riverside township with a mortgage: 2,618 (177 second mortgage, 394 home equity loan, 9 both second mortgage and home equity loan)
Houses without a mortgage: 1,873
- Professional, scientific, and technical services (13%)
- Finance and insurance (9%)
- Construction (6%)
- Educational services (5%)
- Public administration (5%)
- Health care (4%)
- Accommodation and food services (4%)
- Health care (16%)
- Educational services (15%)
- Professional, scientific, and technical services (10%)
- Finance and insurance (10%)
- Accommodation and food services (6%)
- Administrative and support and waste management services (3%)
- Arts, entertainment, and recreation (3%)
- Sales representatives, services, wholesale and manufacturing (8%)
- Other management occupations except farmers and farm managers (6%)
- Other sales and related workers including supervisors (6%)
- Top executives (4%)
- Other office and administrative support workers including supervisors (4%)
- Driver/sales workers and truck drivers (4%)
- Retail sales workers except cashiers (3%)
- Secretaries and administrative assistants (7%)
- Other office and administrative support workers including supervisors (5%)
- Preschool, kindergarten, elementary and middle school teachers (5%)
- Information and record clerks except customer service representatives (5%)
- Business operations specialists (4%)
- Other management occupations except farmers and farm managers (4%)
- Registered nurses (4%)
Most common first ancestries reported in Riverside township:
- Polish (16.4%)
- Irish (13.4%)
- Italian (12.1%)
- German (11.9%)
- Czech (6.5%)
- English (3.9%)
- Lithuanian (2.6%)
Most common places of birth for the foreign-born residents:
- Mexico (15%)
- Poland (13%)
- Czechoslovakia (includes Czech Republic and Slovakia) (9%)
- Other Eastern Europe (7%)
- Philippines (7%)
- China, excluding Hong Kong and Taiwan (6%)
- Italy (5%)
Means of transportation to work:
- Drove a car alone: 5,613 (75%)
- Carpooled: 518 (7%)
- Bus or trolley bus: 65 (1%)
- Subway or elevated: 84 (1%)
- Railroad: 768 (10%)
- Motorcycle: 9 (0%)
- Walked: 137 (2%)
- Other means: 6 (0%)
- Worked at home: 256 (3%)
Most commonly used house heating fuel:
- Utility gas (92%)
- Electricity (5%)
- No fuel used (1%)
- Fuel oil, kerosene, etc. (1%)
548 people in nursing homes
59 people in other noninstitutional group quarters
83.3% of residents of Riverside township speak English at home.
3.8% of residents speak Spanish at home (73% speak English very well, 15% speak English well, 11% speak English not well).
10.5% of residents speak other Indo-European language at home (65% speak English very well, 23% speak English well, 11% speak English not well, 1% don't speak English at all).
1.9% of residents speak Asian or Pacific Island language at home (48% speak English very well, 25% speak English well, 27% speak English not well).
0.4% of residents speak other language at home (100% speak English very well).
Household type by relationship:
Households: 15,099- In family households: 12,511 (3,213 male householders, 923 female householders)
3,459 spouses, 4,414 children (4,196 natural, 94 adopted, 124 stepchildren), 18 grandchildren, 122 brothers or sisters, 183 parents, 77 other relatives, 102 non-relatives
- In nonfamily households: 2,588 (970 male householders (838 living alone)), 1,323 female householders (1,163 living alone)), 295 nonrelatives
- In group quarters: 605 (546 institutionalized population)
Size of family households: 1,909 2-persons, 918 3-persons, 817 4-persons, 374 5-persons, 111 6-persons, 7 7-or-more-persons,
Size of nonfamily households: 2,001 1-person, 275 2-persons, 17 3-persons,
2,711 married couples with children.
385 single-parent households (67 men, 318 women).
Private vs. public school enrollment:
Students in private schools in grades 1 to 8 (elementary and middle school): 297
| Here: | 20.5% |
| Illinois: | 13.4% |
Students in private schools in grades 9 to 12 (high school): 131
| Here: | 21.7% |
| Illinois: | 11.1% |
Students in private undergraduate colleges: 297
| Here: | 47.8% |
| Illinois: | 25.8% |