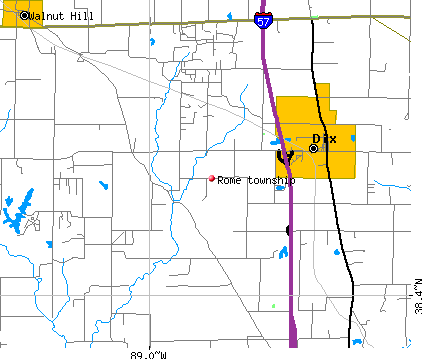
Rome township, Jefferson County, Illinois (IL) detailed profile
Number of foreign born residents: 0 (20% naturalized citizens)
| Rome township: | 0.3% |
| Whole state: | 12.3% |
65% of Rome township residents lived in the same house 5 years ago.
Out of people who lived in different houses, 47% lived in this county.
Out of people who lived in different counties, 77% lived in Illinois.
Place of birth for U.S.-born residents:
- This state: 1405
- Northeast: 6
- Midwest: 144
- South: 114
- West: 48
Median price asked for vacant for-sale houses in 2000: $11,500
Percentage of households with unmarried partners: 3.4%
Likely homosexual households (counted as self-reported same-sex unmarried-partner households)
- Lesbian couples: 0.0% of all households
- Gay men: 0.1% of all households
Housing units in structures:
- One, detached: 443
- One, attached: 5
- Two: 7
- 3 or 4: 4
- 20 to 49: 10
- 50 or more: 122
- Mobile homes: 192
- Boats, RVs, vans, etc.: 4
Median worth of mobile homes: $37,800
Housing units in Rome township with a mortgage: 136 (18 second mortgage, 12 home equity loan, 0 both second mortgage and home equity loan)
Houses without a mortgage: 86
- Construction (14%)
- Plastics and rubber products (11%)
- Public administration (7%)
- Pharmacies and drug stores (6%)
- Educational services (4%)
- Professional, scientific, and technical services (4%)
- Agriculture, forestry, fishing and hunting (4%)
- Health care (23%)
- Accommodation and food services (10%)
- Educational services (8%)
- Finance and insurance (7%)
- Social assistance (6%)
- Personal and laundry services (3%)
- Electrical equipment, appliances, and components (3%)
- Other production occupations including supervisors (11%)
- Construction trades workers except carpenters, electricians, painters, plumbers, and construction laborers (7%)
- Driver/sales workers and truck drivers (7%)
- Electrical equipment mechanics and other installation, maintenance, and repair occupations including supervisors (4%)
- Building and grounds cleaning and maintenance occupations (4%)
- Material recording, scheduling, dispatching, and distributing workers (4%)
- Material moving workers except supervisors and laborers and material movers, hand (4%)
- Other office and administrative support workers including supervisors (8%)
- Material recording, scheduling, dispatching, and distributing workers (6%)
- Bookkeeping, accounting, and auditing clerks (5%)
- Retail sales workers except cashiers (4%)
- Cooks and food preparation workers (4%)
- Waiters and waitresses (4%)
- Cashiers (4%)
Most common first ancestries reported in Rome township:
- United States or American (36.5%)
- German (20.0%)
- English (14.2%)
- Irish (10.9%)
- Scottish (2.9%)
- Dutch (1.4%)
- French (except Basque) (1.3%)
Most common places of birth for the foreign-born residents:
- Mexico (80%)
Means of transportation to work:
- Drove a car alone: 717 (86%)
- Carpooled: 49 (6%)
- Bus or trolley bus: 2 (0%)
- Ferryboat: 5 (1%)
- Walked: 19 (2%)
- Other means: 4 (0%)
- Worked at home: 41 (5%)
Most commonly used house heating fuel:
- Electricity (37%)
- Bottled, tank, or LP gas (37%)
- Utility gas (21%)
- Wood (4%)
- Fuel oil, kerosene, etc. (1%)
98.7% of residents of Rome township speak English at home.
1.0% of residents speak Spanish at home (59% speak English very well, 24% speak English well, 18% speak English not well).
0.2% of residents speak other Indo-European language at home (100% speak English very well).
Household type by relationship:
Households: 1,739- In family households: 1,470 (421 male householders, 75 female householders)
411 spouses, 502 children (462 natural, 3 adopted, 37 stepchildren), 22 grandchildren, 0 brothers or sisters, 2 parents, 4 other relatives, 33 non-relatives
- In nonfamily households: 269 (87 male householders (85 living alone)), 166 female householders (154 living alone)), 16 nonrelatives
Size of family households: 232 2-persons, 107 3-persons, 93 4-persons, 43 5-persons, 11 6-persons, 10 7-or-more-persons,
Size of nonfamily households: 239 1-person, 14 2-persons,
379 married couples with children.
55 single-parent households (16 men, 39 women).
Private vs. public school enrollment:
Students in private schools in grades 1 to 8 (elementary and middle school): 10
| Here: | 4.2% |
| Illinois: | 13.4% |
Students in private schools in grades 9 to 12 (high school): 0
| Here: | 0.0% |
| Illinois: | 11.1% |
Students in private undergraduate colleges: 0
| Here: | 0.0% |
| Illinois: | 25.8% |