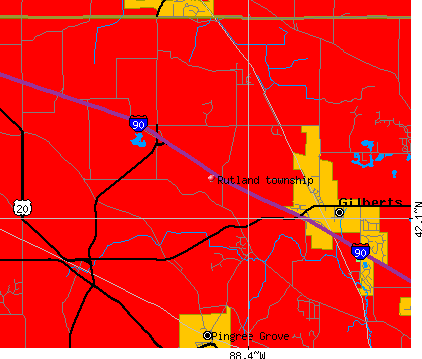
Rutland township, Kane County, Illinois (IL) detailed profile
Number of foreign born residents: 6 (62% naturalized citizens)
| Rutland township: | 6.4% |
| Whole state: | 12.3% |
55% of Rutland township residents lived in the same house 5 years ago.
Out of people who lived in different houses, 21% lived in this county.
Out of people who lived in different counties, 82% lived in Illinois.
Place of birth for U.S.-born residents:
- This state: 3011
- Northeast: 163
- Midwest: 354
- South: 192
- West: 65
Median price asked for vacant for-sale houses in 2000: $65,000
Percentage of households with unmarried partners: 2.1%
Likely homosexual households (counted as self-reported same-sex unmarried-partner households)
- Lesbian couples: 0.1% of all households
- Gay men: 0.0% of all households

Housing units in structures:
- One, detached: 1,619
- One, attached: 13
- Two: 2
- 3 or 4: 9
- 10 to 19: 3
- Mobile homes: 7
Housing units in Rutland township with a mortgage: 861 (40 second mortgage, 94 home equity loan, 0 both second mortgage and home equity loan)
Houses without a mortgage: 498
- Construction (13%)
- Professional, scientific, and technical services (7%)
- Public administration (6%)
- Repair and maintenance (6%)
- Finance and insurance (4%)
- Broadcasting, internet publishing, and telecommunications services (4%)
- Electrical equipment, appliances, and components (4%)
- Finance and insurance (15%)
- Educational services (12%)
- Health care (9%)
- Computer and electronic products (8%)
- Professional, scientific, and technical services (6%)
- Accommodation and food services (5%)
- Broadcasting, internet publishing, and telecommunications services (3%)
- Other management occupations except farmers and farm managers (8%)
- Sales representatives, services, wholesale and manufacturing (8%)
- Vehicle and mobile equipment mechanics, installers, and repairers (7%)
- Art and design workers (4%)
- Electrical equipment mechanics and other installation, maintenance, and repair occupations including supervisors (4%)
- Other sales and related workers including supervisors (3%)
- Computer specialists (3%)
- Other office and administrative support workers including supervisors (13%)
- Secretaries and administrative assistants (8%)
- Information and record clerks except customer service representatives (5%)
- Financial clerks except bookkeeping, accounting, and auditing clerks (5%)
- Retail sales workers except cashiers (4%)
- Other management occupations except farmers and farm managers (4%)
- Preschool, kindergarten, elementary and middle school teachers (3%)
Most common first ancestries reported in Rutland township:
- German (28.2%)
- Italian (12.5%)
- Polish (8.6%)
- Irish (8.5%)
- English (7.0%)
- Swedish (4.9%)
- United States or American (4.4%)
Most common places of birth for the foreign-born residents:
- Germany (23%)
- Italy (9%)
- Mexico (9%)
- United Kingdom (8%)
- Sweden (7%)
- Philippines (5%)
- Poland (4%)
Means of transportation to work:
- Drove a car alone: 1,502 (79%)
- Carpooled: 224 (12%)
- Railroad: 49 (3%)
- Walked: 29 (2%)
- Other means: 5 (0%)
- Worked at home: 98 (5%)
Most commonly used house heating fuel:
- Utility gas (85%)
- Electricity (6%)
- Bottled, tank, or LP gas (6%)
- Fuel oil, kerosene, etc. (2%)
- Other fuel (1%)
92.6% of residents of Rutland township speak English at home.
2.2% of residents speak Spanish at home (49% speak English very well, 24% speak English well, 19% speak English not well, 8% don't speak English at all).
4.8% of residents speak other Indo-European language at home (99% speak English very well, 1% speak English not well).
0.4% of residents speak Asian or Pacific Island language at home (41% speak English very well, 59% speak English well).
Household type by relationship:
Households: 4,062- In family households: 3,785 (1,232 male householders, 60 female householders)
1,240 spouses, 1,033 children (936 natural, 53 adopted, 44 stepchildren), 38 grandchildren, 20 brothers or sisters, 24 parents, 42 other relatives, 96 non-relatives
- In nonfamily households: 277 (112 male householders (102 living alone)), 119 female householders (110 living alone)), 46 nonrelatives
Size of family households: 726 2-persons, 189 3-persons, 218 4-persons, 108 5-persons, 46 6-persons, 5 7-or-more-persons,
Size of nonfamily households: 212 1-person, 9 2-persons, 10 4-persons,
709 married couples with children.
66 single-parent households (28 men, 38 women).
Private vs. public school enrollment:
Students in private schools in grades 1 to 8 (elementary and middle school): 104
| Here: | 26.3% |
| Illinois: | 13.4% |
Students in private schools in grades 9 to 12 (high school): 21
| Here: | 8.5% |
| Illinois: | 11.1% |
Students in private undergraduate colleges: 54
| Here: | 39.1% |
| Illinois: | 25.8% |