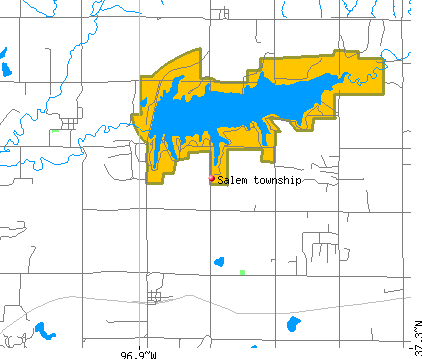
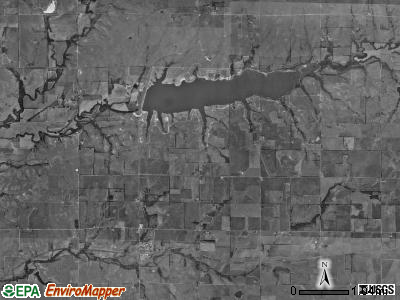
Salem township, Cowley County, Kansas (KS) detailed profile
Land area: 25.6 sq. mi.
Water area: 0.1 sq. mi.
Population: 364 (all rural)
| Males: 193 | |
| Females: 171 |
Occupied houses/apartments: 364 (336 owner occupied, 28 renter occupied)
| % of renters here: | 8% |
| State: | 31% |
Races in Salem township:
- White Non-Hispanic: 95.1%
- American Indian and Alaska Native: 2.7%
- Two or more races: 1.6%
Median age of males: 36.3
Median age of females: 36.5
Discuss Kansas on our huge forum. We have over 16 million posts!
Average household size: 2.91
| Salem township: | 2.9 people |
| Kansas: | 2.5 people |
Average family size: 3.19
| Salem township: | $41,573 |
| Kansas: | $50,972 |
| Here: | $439 |
| State: | $569 |
Estimated median house or condo value in 2013: $81,416 (it was $55,200 in 2000)
| : | $81,416 |
| Kansas: | $129,700 |
| Population density: 14 people per square mile | (low). |
| This township: | 10.5% |
| Whole state: | 9.9% |
| This township: | 2.3% |
| Whole state: | 4.1% |
Notable locations in this township outside city limits:
Cemetery: Salem Cemetery (1). Display/hide its location on the map
58% of Salem township residents lived in the same house 5 years ago.
Out of people who lived in different houses, 54% lived in this county.
Out of people who lived in different counties, 77% lived in Kansas.
Place of birth for U.S.-born residents:
- This state: 306
- Northeast: 0
- Midwest: 22
- South: 33
- West: 26
Percentage of households with unmarried partners: 3.2%
No gay or lesbian households reported
Housing units in structures:
- One, detached: 118
- Mobile homes: 48
Median worth of mobile homes: $64,200
Housing units in Salem township with a mortgage: 45 (11 second mortgage, 2 home equity loan, 0 both second mortgage and home equity loan)
Houses without a mortgage: 18
- Construction (26%)
- Transportation equipment (22%)
- Plastics and rubber products (9%)
- Public administration (9%)
- Agriculture, forestry, fishing and hunting (5%)
- Machinery (5%)
- Educational services (5%)
- Public administration (27%)
- Educational services (24%)
- Transportation equipment (14%)
- Finance and insurance (10%)
- Health care (10%)
- Accommodation and food services (8%)
- Broadcasting, internet publishing, and telecommunications services (3%)
- Construction laborers (14%)
- Assemblers and fabricators (10%)
- Metal workers and plastic workers (10%)
- Law enforcement workers including supervisors (9%)
- Construction trades workers except carpenters, electricians, painters, plumbers, and construction laborers (7%)
- Other production occupations including supervisors (6%)
- Farmers and farm managers (5%)
- Assemblers and fabricators (14%)
- Business operations specialists (11%)
- Bus drivers (11%)
- Health technologists and technicians (10%)
- Bookkeeping, accounting, and auditing clerks (10%)
- Preschool, kindergarten, elementary and middle school teachers (8%)
- Law enforcement workers including supervisors (8%)
Most common first ancestries reported in Salem township:
- United States or American (47.1%)
- German (20.0%)
- English (9.8%)
- Swedish (4.1%)
- Scandinavian (3.4%)
- Scottish (3.4%)
- Dutch (2.7%)
Means of transportation to work:
- Drove a car alone: 163 (84%)
- Carpooled: 29 (15%)
- Worked at home: 3 (2%)
Most commonly used house heating fuel:
- Bottled, tank, or LP gas (64%)
- Electricity (19%)
- Utility gas (12%)
- Wood (5%)
All residents speak only English at home
Household type by relationship:
Households: 389- In family households: 370 (104 male householders, 14 female householders)
117 spouses, 115 children (100 natural, 0 adopted, 15 stepchildren), 7 grandchildren, 0 brothers or sisters, 0 parents, 12 other relatives, 1 non-relatives
- In nonfamily households: 19 (11 male householders (11 living alone)), 8 female householders (8 living alone)), 0 nonrelatives
Size of family households: 46 2-persons, 40 3-persons, 15 4-persons, 15 5-persons, 2 6-persons,
Size of nonfamily households: 19 1-person,
95 married couples with children.
8 single-parent households (1 men, 7 women).
Private vs. public school enrollment:
Students in private schools in grades 1 to 8 (elementary and middle school): 0
| Here: | 0.0% |
| Kansas: | 11.1% |
Students in private schools in grades 9 to 12 (high school): 0
| Here: | 0.0% |
| Kansas: | 7.9% |
Students in private undergraduate colleges: 0
| Here: | 0.0% |
| Kansas: | 13.8% |