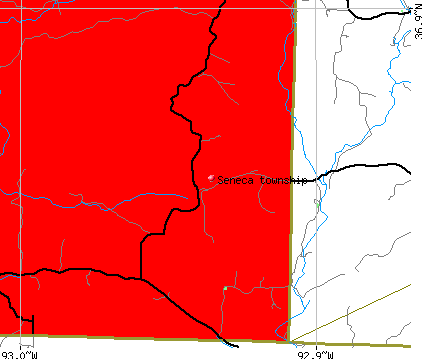
Seneca township, Christian County, Missouri (MO) detailed profile
Land area: 18.2 sq. mi.
Water area: 0.0 sq. mi.
Population: 92 (all rural)
| Males: 44 | |
| Females: 48 |
Occupied houses/apartments: 92 (72 owner occupied, 20 renter occupied)
| % of renters here: | 22% |
| State: | 30% |
Races in Seneca township:
- White Non-Hispanic: 98.9%
Median age of males: 43.0
Median age of females: 45.0
Discuss Missouri on our huge forum. We have over 16 million posts!
Average household size: 2.36
| Seneca township: | 2.4 people |
| Missouri: | 2.5 people |
Average family size: 2.82
| Seneca township: | $51,342 |
| Missouri: | $46,931 |
| Here: | $576 |
| State: | $566 |
Estimated median house or condo value in 2013: $139,400 (it was $96,100 in 2000)
| : | $139,400 |
| Missouri: | $133,200 |
| Population density: 5 people per square mile | (very low). |
| This township: | 15.2% |
| Whole state: | 11.7% |
Notable locations in this township outside city limits:
Notable location: Swan Lookout (A). Display/hide its location on the map
Cemetery: Martin Cemetery (1). Display/hide its location on the map
72% of Seneca township residents lived in the same house 5 years ago.
Out of people who lived in different houses, 7% lived in this county.
Out of people who lived in different counties, 84% lived in Missouri.
Place of birth for U.S.-born residents:
- This state: 86
- Northeast: 3
- Midwest: 3
- South: 1
- West: 6
Percentage of households with unmarried partners: 2.6%
No gay or lesbian households reported
Housing units in structures:
- One, detached: 35
- Mobile homes: 11
Median worth of mobile homes: $87,500
Housing units in Seneca township with a mortgage: 6 (0 second mortgage, 0 home equity loan, 0 both second mortgage and home equity loan)
Houses without a mortgage: 3
- Construction (13%)
- Wood products (8%)
- Plastics and rubber products (7%)
- Truck transportation (6%)
- Groceries and related products merchant wholesalers (6%)
- Food (5%)
- Machinery (5%)
- Health care (24%)
- Transportation equipment (11%)
- Electrical equipment, appliances, and components (9%)
- Food and beverage stores (9%)
- Agriculture, forestry, fishing and hunting (5%)
- Administrative and support and waste management services (5%)
- Accommodation and food services (5%)
- Other production occupations including supervisors (15%)
- Assemblers and fabricators (11%)
- Electrical equipment mechanics and other installation, maintenance, and repair occupations including supervisors (9%)
- Other management occupations except farmers and farm managers (7%)
- Driver/sales workers and truck drivers (7%)
- Metal workers and plastic workers (6%)
- Building and grounds cleaning and maintenance occupations (6%)
- Assemblers and fabricators (13%)
- Other production occupations including supervisors (11%)
- Registered nurses (9%)
- Business operations specialists (7%)
- Therapists (6%)
- Cashiers (6%)
- Operations specialties managers except financial managers (5%)
Most common first ancestries reported in Seneca township:
- German (25.4%)
- English (18.6%)
- European (15.3%)
- Irish (10.2%)
- United States or American (8.5%)
- Scotch-Irish (6.8%)
Means of transportation to work:
- Drove a car alone: 35 (70%)
- Carpooled: 13 (26%)
- Worked at home: 2 (4%)
Most commonly used house heating fuel:
- Wood (55%)
- Bottled, tank, or LP gas (31%)
- Electricity (14%)
97.9% of residents of Seneca township speak English at home.
2.1% of residents speak Spanish at home (100% speak English very well).
Household type by relationship:
Households: 99- In family households: 87 (29 male householders, 2 female householders)
27 spouses, 29 children (29 natural, 0 adopted, 0 stepchildren), 0 grandchildren, 0 brothers or sisters, 0 parents, 0 other relatives, 0 non-relatives
- In nonfamily households: 12 (2 male householders (2 living alone)), 8 female householders (5 living alone)), 2 nonrelatives
Size of family households: 14 2-persons, 8 3-persons, 7 4-persons, 2 5-persons,
Size of nonfamily households: 7 1-person, 3 2-persons,
15 married couples with children.
6 single-parent households (2 men, 4 women).
Private vs. public school enrollment:
Students in private schools in grades 1 to 8 (elementary and middle school): 0
| Here: | 0.0% |
| Missouri: | 13.7% |
Students in private schools in grades 9 to 12 (high school): 0
| Here: | 0.0% |
| Missouri: | 11.6% |
Students in private undergraduate colleges: 0
| Here: | 0.0% |
| Missouri: | 24.9% |