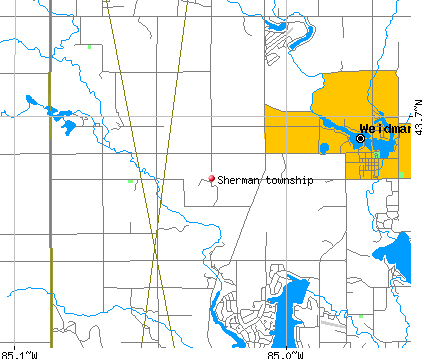
Sherman township, Isabella County, Michigan (MI) detailed profile
Number of foreign born residents: 0 (100% naturalized citizens)
| Sherman township: | 0.3% |
| Whole state: | 5.3% |
64% of Sherman township residents lived in the same house 5 years ago.
Out of people who lived in different houses, 62% lived in this county.
Out of people who lived in different counties, 82% lived in Michigan.
Place of birth for U.S.-born residents:
- This state: 1177
- Northeast: 7
- Midwest: 163
- South: 76
- West: 54
Median price asked for vacant for-sale houses in 2000: $21,700
Percentage of households with unmarried partners: 7.9%
Likely homosexual households (counted as self-reported same-sex unmarried-partner households)
- Lesbian couples: 0.2% of all households
- Gay men: 0.4% of all households
9 people in homes for the mentally retarded
5 people in other group homes

Housing units in structures:
- One, detached: 501
- One, attached: 3
- Two: 16
- 3 or 4: 9
- 5 to 9: 15
- 10 to 19: 3
- Mobile homes: 80
Median worth of mobile homes: $30,000
Housing units in Sherman township with a mortgage: 183 (18 second mortgage, 11 home equity loan, 2 both second mortgage and home equity loan)
Houses without a mortgage: 130
- Construction (14%)
- Machinery (13%)
- Accommodation and food services (6%)
- Educational services (6%)
- Transportation equipment (4%)
- Public administration (4%)
- Health care (3%)
- Health care (14%)
- Educational services (12%)
- Arts, entertainment, and recreation (10%)
- Accommodation and food services (9%)
- Social assistance (5%)
- Private households (5%)
- Food and beverage stores (5%)
- Other management occupations except farmers and farm managers (8%)
- Driver/sales workers and truck drivers (7%)
- Assemblers and fabricators (7%)
- Metal workers and plastic workers (6%)
- Electrical equipment mechanics and other installation, maintenance, and repair occupations including supervisors (6%)
- Construction trades workers except carpenters, electricians, painters, plumbers, and construction laborers (5%)
- Building and grounds cleaning and maintenance occupations (4%)
- Building and grounds cleaning and maintenance occupations (9%)
- Assemblers and fabricators (7%)
- Preschool, kindergarten, elementary and middle school teachers (6%)
- Cashiers (5%)
- Secretaries and administrative assistants (5%)
- Child care workers (5%)
- Other food preparation and serving workers including supervisors (4%)
Most common first ancestries reported in Sherman township:
- German (34.4%)
- English (17.0%)
- United States or American (15.9%)
- Irish (9.1%)
- French (except Basque) (4.6%)
- Dutch (2.1%)
- Scotch-Irish (2.1%)
Most common places of birth for the foreign-born residents:
- Canada (63%)
- United Kingdom (38%)
Means of transportation to work:
- Drove a car alone: 598 (78%)
- Carpooled: 137 (18%)
- Walked: 9 (1%)
- Other means: 8 (1%)
- Worked at home: 19 (2%)
Most commonly used house heating fuel:
- Utility gas (66%)
- Bottled, tank, or LP gas (21%)
- Electricity (8%)
- Wood (4%)
9 people in homes for the mentally retarded
5 people in other group homes
98.5% of residents of Sherman township speak English at home.
1.3% of residents speak Spanish at home (78% speak English very well, 22% speak English well).
0.2% of residents speak other Indo-European language at home (100% speak English very well).
Household type by relationship:
Households: 1,464- In family households: 1,253 (353 male householders, 59 female householders)
358 spouses, 431 children (366 natural, 16 adopted, 49 stepchildren), 9 grandchildren, 9 brothers or sisters, 6 parents, 7 other relatives, 21 non-relatives
- In nonfamily households: 211 (62 male householders (38 living alone)), 103 female householders (87 living alone)), 46 nonrelatives
- In group quarters: 23 (all institutionalized)
Size of family households: 188 2-persons, 102 3-persons, 72 4-persons, 34 5-persons, 9 6-persons, 7 7-or-more-persons,
Size of nonfamily households: 125 1-person, 33 2-persons, 4 3-persons, 3 4-persons,
419 married couples with children.
163 single-parent households (47 men, 116 women).
Private vs. public school enrollment:
Students in private schools in grades 1 to 8 (elementary and middle school): 3
| Here: | 1.6% |
| Michigan: | 11.2% |
Students in private schools in grades 9 to 12 (high school): 2
| Here: | 1.8% |
| Michigan: | 8.7% |
Students in private undergraduate colleges: 1
| Here: | 2.9% |
| Michigan: | 16.5% |