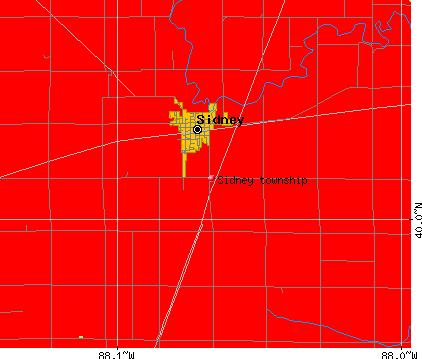
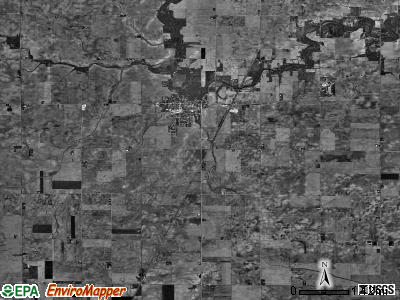
Sidney township, Champaign County, Illinois (IL) detailed profile
Number of foreign born residents: 0 (0% naturalized citizens)
| Sidney township: | 0.4% |
| Whole state: | 12.3% |
71% of Sidney township residents lived in the same house 5 years ago.
Out of people who lived in different houses, 79% lived in this county.
Out of people who lived in different counties, 63% lived in Illinois.
Place of birth for U.S.-born residents:
- This state: 1382
- Northeast: 27
- Midwest: 110
- South: 76
- West: 11
Median price asked for vacant for-sale houses in 2000: $72,500
Percentage of households with unmarried partners: 5.5%
Likely homosexual households (counted as self-reported same-sex unmarried-partner households)
- Lesbian couples: 0.6% of all households
- Gay men: 0.2% of all households
Housing units in structures:
- One, detached: 588
- One, attached: 7
- Two: 37
- 3 or 4: 10
- Mobile homes: 12
Median worth of mobile homes: $23,300
Housing units in Sidney township with a mortgage: 252 (21 second mortgage, 19 home equity loan, 4 both second mortgage and home equity loan)
Houses without a mortgage: 177
- Construction (14%)
- Educational services (14%)
- Accommodation and food services (7%)
- Administrative and support and waste management services (7%)
- Agriculture, forestry, fishing and hunting (4%)
- Professional, scientific, and technical services (4%)
- Health care (3%)
- Educational services (24%)
- Health care (14%)
- Finance and insurance (6%)
- Public administration (5%)
- Accommodation and food services (5%)
- Professional, scientific, and technical services (4%)
- Administrative and support and waste management services (4%)
- Building and grounds cleaning and maintenance occupations (8%)
- Electrical equipment mechanics and other installation, maintenance, and repair occupations including supervisors (6%)
- Postsecondary teachers (5%)
- Other office and administrative support workers including supervisors (5%)
- Material recording, scheduling, dispatching, and distributing workers (5%)
- Sales representatives, services, wholesale and manufacturing (5%)
- Driver/sales workers and truck drivers (4%)
- Other office and administrative support workers including supervisors (7%)
- Secretaries and administrative assistants (6%)
- Business operations specialists (6%)
- Preschool, kindergarten, elementary and middle school teachers (6%)
- Other sales and related workers including supervisors (6%)
- Other management occupations except farmers and farm managers (5%)
- Building and grounds cleaning and maintenance occupations (5%)
Most common first ancestries reported in Sidney township:
- German (35.7%)
- United States or American (24.5%)
- English (10.9%)
- Irish (9.2%)
- Dutch (2.3%)
- French (except Basque) (2.2%)
- European (1.4%)
Most common places of birth for the foreign-born residents:
- United Kingdom (100%)
Means of transportation to work:
- Drove a car alone: 648 (79%)
- Carpooled: 91 (11%)
- Bus or trolley bus: 14 (2%)
- Walked: 4 (0%)
- Other means: 12 (1%)
- Worked at home: 54 (7%)
Most commonly used house heating fuel:
- Utility gas (70%)
- Bottled, tank, or LP gas (19%)
- Electricity (9%)
- Wood (2%)
98.5% of residents of Sidney township speak English at home.
1.1% of residents speak Spanish at home (53% speak English very well, 18% speak English well, 29% speak English not well).
0.3% of residents speak other Indo-European language at home (100% speak English very well).
Household type by relationship:
Households: 1,616- In family households: 1,432 (349 male householders, 110 female householders)
417 spouses, 504 children (449 natural, 16 adopted, 39 stepchildren), 20 grandchildren, 3 brothers or sisters, 5 parents, 8 other relatives, 16 non-relatives
- In nonfamily households: 184 (62 male householders (47 living alone)), 93 female householders (78 living alone)), 29 nonrelatives
Size of family households: 186 2-persons, 123 3-persons, 107 4-persons, 33 5-persons, 10 6-persons,
Size of nonfamily households: 125 1-person, 28 2-persons, 2 3-persons,
354 married couples with children.
55 single-parent households (15 men, 40 women).
Private vs. public school enrollment:
Students in private schools in grades 1 to 8 (elementary and middle school): 13
| Here: | 6.6% |
| Illinois: | 13.4% |
Students in private schools in grades 9 to 12 (high school): 5
| Here: | 4.8% |
| Illinois: | 11.1% |
Students in private undergraduate colleges: 3
| Here: | 6.5% |
| Illinois: | 25.8% |