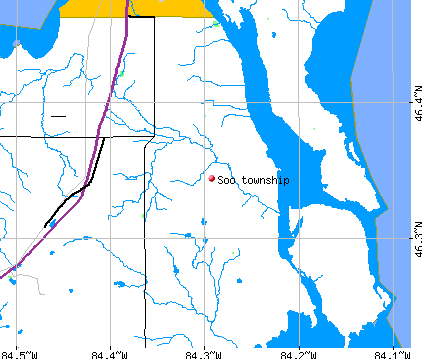
Soo township, Chippewa County, Michigan (MI) detailed profile
Number of foreign born residents: 3 (83% naturalized citizens)
| Soo township: | 3.2% |
| Whole state: | 5.3% |
63% of Soo township residents lived in the same house 5 years ago.
Out of people who lived in different houses, 73% lived in this county.
Out of people who lived in different counties, 61% lived in Michigan.
Place of birth for U.S.-born residents:
- This state: 2076
- Northeast: 58
- Midwest: 202
- South: 94
- West: 48
Median price asked for vacant for-sale houses in 2000: $275,000
Percentage of households with unmarried partners: 4.7%
Likely homosexual households (counted as self-reported same-sex unmarried-partner households)
- Lesbian couples: 0.2% of all households
- Gay men: 0.2% of all households

Housing units in structures:
- One, detached: 1,067
- One, attached: 4
- Two: 12
- 3 or 4: 30
- 5 to 9: 4
- 10 to 19: 54
- 20 to 49: 4
- Mobile homes: 132
Median worth of mobile homes: $35,000
Housing units in Soo township with a mortgage: 334 (25 second mortgage, 26 home equity loan, 4 both second mortgage and home equity loan)
Houses without a mortgage: 252
- Public administration (22%)
- Construction (11%)
- Educational services (9%)
- Utilities (6%)
- Accommodation and food services (6%)
- Arts, entertainment, and recreation (6%)
- Administrative and support and waste management services (3%)
- Educational services (18%)
- Health care (16%)
- Public administration (11%)
- Accommodation and food services (9%)
- Arts, entertainment, and recreation (7%)
- Professional, scientific, and technical services (4%)
- Social assistance (4%)
- Law enforcement workers including supervisors (14%)
- Other sales and related workers including supervisors (9%)
- Building and grounds cleaning and maintenance occupations (7%)
- Electrical equipment mechanics and other installation, maintenance, and repair occupations including supervisors (5%)
- Other production occupations including supervisors (5%)
- Other management occupations except farmers and farm managers (5%)
- Driver/sales workers and truck drivers (5%)
- Secretaries and administrative assistants (9%)
- Other office and administrative support workers including supervisors (6%)
- Cashiers (6%)
- Waiters and waitresses (5%)
- Food and beverage serving workers except waiters/waitresses (4%)
- Preschool, kindergarten, elementary and middle school teachers (4%)
- Supervisors and other personal care and service workers except personal appearance, transportation, and child care workers (4%)
Most common first ancestries reported in Soo township:
- German (14.4%)
- English (13.6%)
- Irish (12.5%)
- French (except Basque) (7.3%)
- Polish (6.9%)
- Italian (6.8%)
- Finnish (4.1%)
Most common places of birth for the foreign-born residents:
- Canada (77%)
- Germany (17%)
- Italy (4%)
- France (2%)
Means of transportation to work:
- Drove a car alone: 1,026 (77%)
- Carpooled: 217 (16%)
- Bus or trolley bus: 12 (1%)
- Ferryboat: 8 (1%)
- Bicycle: 4 (0%)
- Walked: 11 (1%)
- Worked at home: 48 (4%)
Most commonly used house heating fuel:
- Utility gas (41%)
- Electricity (21%)
- Bottled, tank, or LP gas (19%)
- Fuel oil, kerosene, etc. (13%)
- Wood (6%)
99.1% of residents of Soo township speak English at home.
0.2% of residents speak Spanish at home (100% speak English not well).
0.6% of residents speak other Indo-European language at home (56% speak English very well, 44% speak English well).
Household type by relationship:
Households: 2,651- In family households: 2,321 (692 male householders, 127 female householders)
678 spouses, 749 children (630 natural, 55 adopted, 64 stepchildren), 8 grandchildren, 4 brothers or sisters, 12 parents, 7 other relatives, 44 non-relatives
- In nonfamily households: 330 (166 male householders (150 living alone)), 128 female householders (112 living alone)), 36 nonrelatives
Size of family households: 457 2-persons, 143 3-persons, 140 4-persons, 66 5-persons, 11 6-persons, 2 7-or-more-persons,
Size of nonfamily households: 262 1-person, 32 2-persons,
473 married couples with children.
108 single-parent households (46 men, 62 women).
Private vs. public school enrollment:
Students in private schools in grades 1 to 8 (elementary and middle school): 11
| Here: | 3.7% |
| Michigan: | 11.2% |
Students in private schools in grades 9 to 12 (high school): 6
| Here: | 4.2% |
| Michigan: | 8.7% |
Students in private undergraduate colleges: 11
| Here: | 10.2% |
| Michigan: | 16.5% |