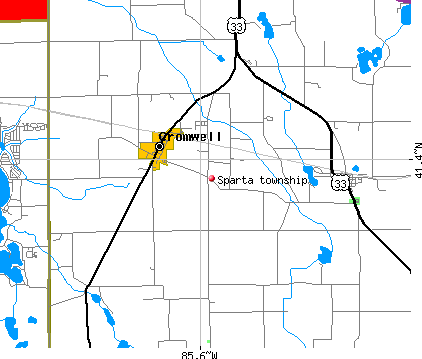
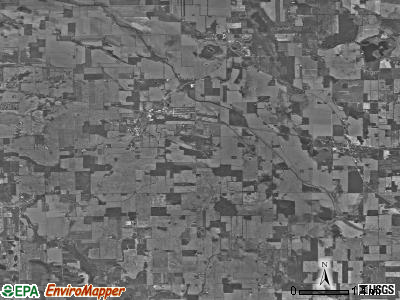
Sparta township, Noble County, Indiana (IN) detailed profile
Number of foreign born residents: 11 (38% naturalized citizens)
| Sparta township: | 11.0% |
| Whole state: | 3.1% |
53% of Sparta township residents lived in the same house 5 years ago.
Out of people who lived in different houses, 56% lived in this county.
Out of people who lived in different counties, 43% lived in Indiana.
Place of birth for U.S.-born residents:
- This state: 2032
- Northeast: 42
- Midwest: 302
- South: 273
- West: 22
Median price asked for vacant for-sale houses in 2000: $73,300
Percentage of households with unmarried partners: 5.7%
Likely homosexual households (counted as self-reported same-sex unmarried-partner households)
- Lesbian couples: 0.6% of all households
- Gay men: 0.1% of all households
Housing units in structures:
- One, detached: 705
- One, attached: 7
- Two: 12
- 3 or 4: 8
- 5 to 9: 28
- 10 to 19: 2
- Mobile homes: 292
- Boats, RVs, vans, etc.: 5
Median worth of mobile homes: $10,400
Housing units in Sparta township with a mortgage: 367 (27 second mortgage, 40 home equity loan, 0 both second mortgage and home equity loan)
Houses without a mortgage: 93
- Transportation equipment (21%)
- Construction (10%)
- Metal and metal products (7%)
- Agriculture, forestry, fishing and hunting (5%)
- Accommodation and food services (5%)
- Truck transportation (4%)
- Wood products (4%)
- Transportation equipment (13%)
- Educational services (11%)
- Plastics and rubber products (8%)
- Health care (7%)
- Social assistance (6%)
- Finance and insurance (5%)
- Metal and metal products (5%)
- Other production occupations including supervisors (12%)
- Metal workers and plastic workers (9%)
- Driver/sales workers and truck drivers (9%)
- Assemblers and fabricators (6%)
- Laborers and material movers, hand (6%)
- Carpenters (4%)
- Other sales and related workers including supervisors (3%)
- Metal workers and plastic workers (10%)
- Assemblers and fabricators (9%)
- Secretaries and administrative assistants (7%)
- Other production occupations including supervisors (6%)
- Preschool, kindergarten, elementary and middle school teachers (5%)
- Other office and administrative support workers including supervisors (5%)
- Cashiers (4%)
Most common first ancestries reported in Sparta township:
- German (27.3%)
- United States or American (20.0%)
- Irish (7.3%)
- English (6.2%)
- Scotch-Irish (1.8%)
- Polish (1.7%)
- Swiss (1.3%)
Most common places of birth for the foreign-born residents:
- Mexico (98%)
- El Salvador (1%)
- Spain (1%)
Means of transportation to work:
- Drove a car alone: 1,021 (73%)
- Carpooled: 253 (18%)
- Bus or trolley bus: 2 (0%)
- Walked: 28 (2%)
- Other means: 11 (1%)
- Worked at home: 75 (5%)
Most commonly used house heating fuel:
- Bottled, tank, or LP gas (41%)
- Utility gas (39%)
- Electricity (14%)
- Wood (3%)
- Fuel oil, kerosene, etc. (2%)
- No fuel used (1%)
80.5% of residents of Sparta township speak English at home.
18.7% of residents speak Spanish at home (46% speak English very well, 16% speak English well, 29% speak English not well, 10% don't speak English at all).
0.8% of residents speak other Indo-European language at home (100% speak English very well).
Household type by relationship:
Households: 3,016- In family households: 2,762 (661 male householders, 112 female householders)
640 spouses, 1,129 children (1,048 natural, 17 adopted, 64 stepchildren), 49 grandchildren, 27 brothers or sisters, 11 parents, 80 other relatives, 53 non-relatives
- In nonfamily households: 254 (101 male householders (65 living alone)), 108 female householders (108 living alone)), 45 nonrelatives
Size of family households: 230 2-persons, 189 3-persons, 186 4-persons, 91 5-persons, 44 6-persons, 33 7-or-more-persons,
Size of nonfamily households: 173 1-person, 29 2-persons, 4 3-persons, 3 5-persons,
761 married couples with children.
187 single-parent households (46 men, 141 women).
Private vs. public school enrollment:
Students in private schools in grades 1 to 8 (elementary and middle school): 20
| Here: | 4.3% |
| Indiana: | 11.8% |
Students in private schools in grades 9 to 12 (high school): 8
| Here: | 4.0% |
| Indiana: | 8.8% |
Students in private undergraduate colleges: 2
| Here: | 6.9% |
| Indiana: | 23.4% |