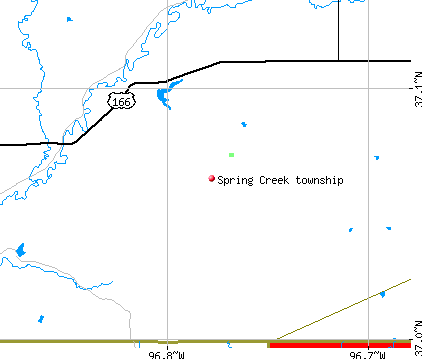
Spring Creek township, Cowley County, Kansas (KS) detailed profile
Number of foreign born residents: 62 (50% naturalized citizens)
| Spring Creek township: | 62.3% |
| Whole state: | 5.0% |
70% of Spring Creek township residents lived in the same house 5 years ago.
Out of people who lived in different houses, 75% lived in this county.
Out of people who lived in different counties, 70% lived in Kansas.
Place of birth for U.S.-born residents:
- This state: 4682
- Northeast: 140
- Midwest: 180
- South: 627
- West: 62
Percentage of households with unmarried partners: 10.7%
No gay or lesbian households reported
Housing units in structures:
- One, detached: 1,674
- One, attached: 48
- Two: 31
- 5 to 9: 8
- 10 to 19: 9
- Mobile homes: 522
Median worth of mobile homes: $25,300
Housing units in Spring Creek township with a mortgage: 831 (65 second mortgage, 66 home equity loan, 9 both second mortgage and home equity loan)
Houses without a mortgage: 442
- Construction (21%)
- Agriculture, forestry, fishing and hunting (9%)
- Machinery (8%)
- Metal and metal products (7%)
- Educational services (5%)
- Professional, scientific, and technical services (4%)
- Truck transportation (4%)
- Health care (19%)
- Finance and insurance (12%)
- Educational services (11%)
- Professional, scientific, and technical services (7%)
- Accommodation and food services (5%)
- Social assistance (5%)
- Food and beverage stores (5%)
- Metal workers and plastic workers (11%)
- Driver/sales workers and truck drivers (8%)
- Farmers and farm managers (6%)
- Construction trades workers except carpenters, electricians, painters, plumbers, and construction laborers (6%)
- Electrical equipment mechanics and other installation, maintenance, and repair occupations including supervisors (6%)
- Material moving workers except supervisors and laborers and material movers, hand (5%)
- Laborers and material movers, hand (4%)
- Material recording, scheduling, dispatching, and distributing workers (7%)
- Information and record clerks except customer service representatives (7%)
- Other management occupations except farmers and farm managers (6%)
- Child care workers (5%)
- Other office and administrative support workers including supervisors (5%)
- Bookkeeping, accounting, and auditing clerks (4%)
- Financial clerks except bookkeeping, accounting, and auditing clerks (4%)
Most common first ancestries reported in Spring Creek township:
- German (32.5%)
- United States or American (28.7%)
- Irish (7.6%)
- English (6.4%)
- Scotch-Irish (3.3%)
- European (2.7%)
- Italian (1.2%)
Most common places of birth for the foreign-born residents:
- Mexico (50%)
- United Kingdom (19%)
- Germany (17%)
- Korea (15%)
Means of transportation to work:
- Drove a car alone: 2,427 (82%)
- Carpooled: 265 (9%)
- Bus or trolley bus: 7 (0%)
- Walked: 31 (1%)
- Other means: 15 (1%)
- Worked at home: 203 (7%)
Most commonly used house heating fuel:
- Fuel oil, kerosene, etc. (44%)
- Electricity (31%)
- Wood (10%)
- Bottled, tank, or LP gas (8%)
- Coal or coke (4%)
- Utility gas (3%)
98.2% of residents of Spring Creek township speak English at home.
0.9% of residents speak Spanish at home (50% speak English very well, 19% speak English well, 31% speak English not well).
0.9% of residents speak other Indo-European language at home (100% speak English very well).
Household type by relationship:
Households: 5,737- In family households: 5,178 (1,468 male householders, 226 female householders)
1,464 spouses, 1,783 children (1,498 natural, 175 adopted, 110 stepchildren), 74 grandchildren, 18 brothers or sisters, 21 parents, 16 other relatives, 108 non-relatives
- In nonfamily households: 559 (189 male householders (123 living alone)), 280 female householders (258 living alone)), 90 nonrelatives
- In group quarters: 38 (0 institutionalized population)
Size of family households: 725 2-persons, 417 3-persons, 331 4-persons, 148 5-persons, 35 6-persons, 38 7-or-more-persons,
Size of nonfamily households: 381 1-person, 88 2-persons,
18 married couples with children.
4 single-parent households (4 men, 0 women).
Private vs. public school enrollment:
Students in private schools in grades 1 to 8 (elementary and middle school): 35
| Here: | 5.4% |
| Kansas: | 11.1% |
Students in private schools in grades 9 to 12 (high school): 65
| Here: | 15.6% |
| Kansas: | 7.9% |
Students in private undergraduate colleges: 30
| Here: | 24.2% |
| Kansas: | 13.8% |