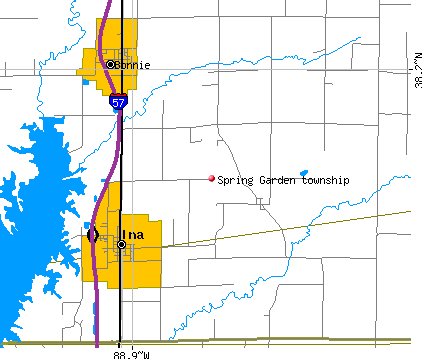
Spring Garden township, Jefferson County, Illinois (IL) detailed profile
Number of foreign born residents: 1 (45% naturalized citizens)
| Spring Garden township: | 1.5% |
| Whole state: | 12.3% |
53% of Spring Garden township residents lived in the same house 5 years ago.
Out of people who lived in different houses, 20% lived in this county.
Out of people who lived in different counties, 75% lived in Illinois.
Place of birth for U.S.-born residents:
- This state: 2834
- Northeast: 27
- Midwest: 205
- South: 247
- West: 57
Median price asked for vacant for-sale houses in 2000: $65,000
Percentage of households with unmarried partners: 3.8%
No gay or lesbian households reported
1,965 people in state prisons

Housing units in structures:
- One, detached: 461
- One, attached: 6
- Two: 19
- 5 to 9: 3
- Mobile homes: 153
Median worth of mobile homes: $34,000
Housing units in Spring Garden township with a mortgage: 135 (2 second mortgage, 12 home equity loan, 2 both second mortgage and home equity loan)
Houses without a mortgage: 134
- Plastics and rubber products (13%)
- Construction (10%)
- Truck transportation (9%)
- Agriculture, forestry, fishing and hunting (6%)
- Public administration (6%)
- Mining, quarrying, and oil and gas extraction (4%)
- Administrative and support and waste management services (4%)
- Educational services (12%)
- Health care (12%)
- Accommodation and food services (12%)
- Finance and insurance (7%)
- Public administration (5%)
- Pharmacies and drug stores (5%)
- Construction (4%)
- Other production occupations including supervisors (12%)
- Driver/sales workers and truck drivers (10%)
- Metal workers and plastic workers (5%)
- Electrical equipment mechanics and other installation, maintenance, and repair occupations including supervisors (5%)
- Building and grounds cleaning and maintenance occupations (5%)
- Farmers and farm managers (5%)
- Material moving workers except supervisors and laborers and material movers, hand (4%)
- Bookkeeping, accounting, and auditing clerks (6%)
- Health technologists and technicians (6%)
- Other office and administrative support workers including supervisors (5%)
- Secretaries and administrative assistants (5%)
- Other management occupations except farmers and farm managers (5%)
- Food and beverage serving workers except waiters/waitresses (5%)
- Retail sales workers except cashiers (4%)
Most common first ancestries reported in Spring Garden township:
- United States or American (23.8%)
- German (19.9%)
- Irish (12.3%)
- English (11.2%)
- French (except Basque) (6.1%)
- Italian (4.0%)
- Polish (3.2%)
Most common places of birth for the foreign-born residents:
- Mexico (51%)
- Germany (16%)
- Cuba (16%)
- Other Western Asia (10%)
- Poland (4%)
- Panama (4%)
Means of transportation to work:
- Drove a car alone: 503 (79%)
- Carpooled: 82 (13%)
- Bicycle: 1 (0%)
- Walked: 24 (4%)
- Other means: 2 (0%)
- Worked at home: 21 (3%)
Most commonly used house heating fuel:
- Utility gas (53%)
- Bottled, tank, or LP gas (23%)
- Electricity (19%)
- Wood (5%)
1,965 people in state prisons
96.7% of residents of Spring Garden township speak English at home.
3.1% of residents speak Spanish at home (53% speak English very well, 13% speak English well, 33% speak English not well).
0.1% of residents speak other Indo-European language at home (75% speak English well, 25% speak English not well).
Household type by relationship:
Households: 1,485- In family households: 1,307 (359 male householders, 57 female householders)
355 spouses, 461 children (438 natural, 9 adopted, 14 stepchildren), 20 grandchildren, 7 brothers or sisters, 6 parents, 6 other relatives, 36 non-relatives
- In nonfamily households: 178 (70 male householders (62 living alone)), 83 female householders (69 living alone)), 25 nonrelatives
- In group quarters: 1,961 (all institutionalized)
Size of family households: 201 2-persons, 72 3-persons, 76 4-persons, 42 5-persons, 25 6-persons,
Size of nonfamily households: 131 1-person, 19 2-persons, 2 3-persons, 1 4-persons,
284 married couples with children.
68 single-parent households (22 men, 46 women).
Private vs. public school enrollment:
Students in private schools in grades 1 to 8 (elementary and middle school): 11
| Here: | 6.1% |
| Illinois: | 13.4% |
Students in private schools in grades 9 to 12 (high school): 22
| Here: | 12.8% |
| Illinois: | 11.1% |
Students in private undergraduate colleges: 0
| Here: | 0.0% |
| Illinois: | 25.8% |