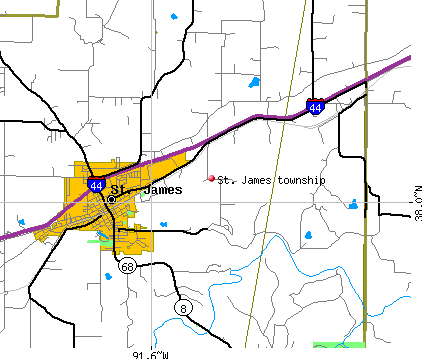
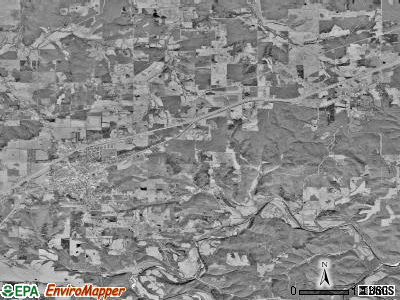
St. James township, Phelps County, Missouri (MO) detailed profile
Number of foreign born residents: 1 (65% naturalized citizens)
| St. James township: | 0.7% |
| Whole state: | 2.7% |
48% of St. James township residents lived in the same house 5 years ago.
Out of people who lived in different houses, 50% lived in this county.
Out of people who lived in different counties, 70% lived in Missouri.
Place of birth for U.S.-born residents:
- This state: 3762
- Northeast: 98
- Midwest: 554
- South: 317
- West: 194
Median price asked for vacant for-sale houses in 2000: $53,800
Percentage of households with unmarried partners: 4.7%
Likely homosexual households (counted as self-reported same-sex unmarried-partner households)
- Lesbian couples: 0.2% of all households
- Gay men: 0.1% of all households
215 people in nursing homes
157 people in homes for abused, dependent, and neglected children
Housing units in structures:
- One, detached: 1,594
- One, attached: 56
- Two: 148
- 3 or 4: 76
- 5 to 9: 11
- 10 to 19: 6
- 20 to 49: 6
- Mobile homes: 217
- Boats, RVs, vans, etc.: 6
Median worth of mobile homes: $23,300
Housing units in St. James township with a mortgage: 504 (50 second mortgage, 22 home equity loan, 0 both second mortgage and home equity loan)
Houses without a mortgage: 427
- Construction (12%)
- Truck transportation (7%)
- Health care (6%)
- Educational services (5%)
- Public administration (5%)
- Accommodation and food services (5%)
- Building material and garden equipment and supplies dealers (4%)
- Health care (18%)
- Educational services (17%)
- Accommodation and food services (8%)
- Finance and insurance (8%)
- Public administration (7%)
- Social assistance (7%)
- Food and beverage stores (5%)
- Electrical equipment mechanics and other installation, maintenance, and repair occupations including supervisors (8%)
- Driver/sales workers and truck drivers (8%)
- Retail sales workers except cashiers (5%)
- Other sales and related workers including supervisors (5%)
- Building and grounds cleaning and maintenance occupations (5%)
- Preschool, kindergarten, elementary and middle school teachers (4%)
- Other production occupations including supervisors (3%)
- Preschool, kindergarten, elementary and middle school teachers (10%)
- Secretaries and administrative assistants (7%)
- Cashiers (7%)
- Nursing, psychiatric, and home health aides (6%)
- Other office and administrative support workers including supervisors (5%)
- Health technologists and technicians (4%)
- Cooks and food preparation workers (4%)
Most common first ancestries reported in St. James township:
- German (23.9%)
- United States or American (22.7%)
- Irish (14.8%)
- English (10.3%)
- Italian (5.2%)
- French (except Basque) (2.5%)
- Dutch (1.6%)
Most common places of birth for the foreign-born residents:
- United Kingdom (35%)
- Austria (18%)
- Germany (18%)
- France (15%)
- Philippines (15%)
Means of transportation to work:
- Drove a car alone: 1,540 (78%)
- Carpooled: 289 (15%)
- Bus or trolley bus: 8 (0%)
- Motorcycle: 5 (0%)
- Bicycle: 7 (0%)
- Walked: 80 (4%)
- Other means: 5 (0%)
- Worked at home: 48 (2%)
Most commonly used house heating fuel:
- Utility gas (36%)
- Electricity (32%)
- Bottled, tank, or LP gas (23%)
- Wood (8%)
- Fuel oil, kerosene, etc. (1%)
215 people in nursing homes
157 people in homes for abused, dependent, and neglected children
98.0% of residents of St. James township speak English at home.
0.5% of residents speak Spanish at home (100% speak English very well).
1.2% of residents speak other Indo-European language at home (89% speak English very well, 11% speak English not well).
0.2% of residents speak Asian or Pacific Island language at home (45% speak English very well, 55% speak English well).
0.1% of residents speak other language at home (100% speak English very well).
Household type by relationship:
Households: 4,607- In family households: 3,836 (1,006 male householders, 281 female householders)
1,041 spouses, 1,271 children (1,128 natural, 56 adopted, 87 stepchildren), 68 grandchildren, 19 brothers or sisters, 12 parents, 26 other relatives, 112 non-relatives
- In nonfamily households: 771 (249 male householders (205 living alone)), 449 female householders (431 living alone)), 73 nonrelatives
- In group quarters: 381 (all institutionalized)
Size of family households: 604 2-persons, 315 3-persons, 236 4-persons, 97 5-persons, 20 6-persons, 15 7-or-more-persons,
Size of nonfamily households: 636 1-person, 48 2-persons, 11 3-persons, 3 4-persons,
808 married couples with children.
347 single-parent households (63 men, 284 women).
Private vs. public school enrollment:
Students in private schools in grades 1 to 8 (elementary and middle school): 71
| Here: | 9.4% |
| Missouri: | 13.7% |
Students in private schools in grades 9 to 12 (high school): 13
| Here: | 4.0% |
| Missouri: | 11.6% |
Students in private undergraduate colleges: 12
| Here: | 7.8% |
| Missouri: | 24.9% |