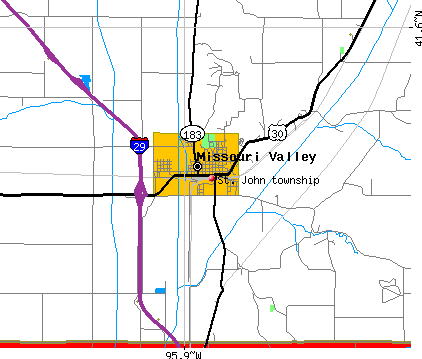
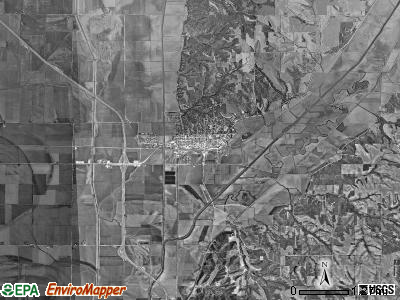
St. John township, Harrison County, Iowa (IA) detailed profile
Number of foreign born residents: 1 (44% naturalized citizens)
| St. John township: | 1.3% |
| Whole state: | 3.1% |
54% of St. John township residents lived in the same house 5 years ago.
Out of people who lived in different houses, 66% lived in this county.
Out of people who lived in different counties, 33% lived in Iowa.
Place of birth for U.S.-born residents:
- This state: 2460
- Northeast: 60
- Midwest: 1466
- South: 138
- West: 93
Median price asked for vacant for-sale houses in 2000: $22,000
Percentage of households with unmarried partners: 5.5%
Likely homosexual households (counted as self-reported same-sex unmarried-partner households)
- Lesbian couples: 0.2% of all households
- Gay men: 0.2% of all households
121 people in nursing homes
Housing units in structures:
- One, detached: 1,385
- One, attached: 30
- Two: 42
- 3 or 4: 84
- 5 to 9: 37
- 10 to 19: 17
- 20 to 49: 27
- 50 or more: 42
- Mobile homes: 133
Median worth of mobile homes: $22,900
Housing units in St. John township with a mortgage: 663 (111 second mortgage, 93 home equity loan, 0 both second mortgage and home equity loan)
Houses without a mortgage: 378
- Construction (13%)
- Motor vehicle and parts dealers (6%)
- Educational services (5%)
- Accommodation and food services (5%)
- Finance and insurance (5%)
- Agriculture, forestry, fishing and hunting (4%)
- Truck transportation (4%)
- Health care (20%)
- Finance and insurance (17%)
- Educational services (15%)
- Accommodation and food services (7%)
- Social assistance (4%)
- Food and beverage stores (4%)
- Administrative and support and waste management services (4%)
- Other management occupations except farmers and farm managers (7%)
- Driver/sales workers and truck drivers (6%)
- Other sales and related workers including supervisors (6%)
- Material recording, scheduling, dispatching, and distributing workers (6%)
- Material moving workers except supervisors and laborers and material movers, hand (5%)
- Carpenters (4%)
- Metal workers and plastic workers (4%)
- Secretaries and administrative assistants (9%)
- Preschool, kindergarten, elementary and middle school teachers (8%)
- Other office and administrative support workers including supervisors (6%)
- Information and record clerks except customer service representatives (5%)
- Sales representatives, services, wholesale and manufacturing (5%)
- Cashiers (4%)
- Retail sales workers except cashiers (4%)
Most common first ancestries reported in St. John township:
- German (39.7%)
- Irish (16.9%)
- English (10.1%)
- United States or American (6.9%)
- Danish (4.4%)
- Dutch (3.2%)
- Swedish (2.6%)
Most common places of birth for the foreign-born residents:
- Canada (30%)
- Germany (22%)
- India (22%)
- Philippines (15%)
- United Kingdom (7%)
- Other Northern Africa (4%)
Means of transportation to work:
- Drove a car alone: 1,603 (77%)
- Carpooled: 324 (16%)
- Bus or trolley bus: 4 (0%)
- Walked: 64 (3%)
- Other means: 22 (1%)
- Worked at home: 61 (3%)
Most commonly used house heating fuel:
- Utility gas (63%)
- Electricity (18%)
- Bottled, tank, or LP gas (15%)
- Fuel oil, kerosene, etc. (2%)
- Wood (1%)
121 people in nursing homes
97.9% of residents of St. John township speak English at home.
1.1% of residents speak Spanish at home (28% speak English very well, 14% speak English well, 58% speak English not well).
0.5% of residents speak other Indo-European language at home (45% speak English very well, 23% speak English well, 32% speak English not well).
0.4% of residents speak Asian or Pacific Island language at home (56% speak English very well, 44% speak English well).
Household type by relationship:
Households: 4,156- In family households: 3,526 (930 male householders, 239 female householders)
1,004 spouses, 1,159 children (1,009 natural, 29 adopted, 121 stepchildren), 82 grandchildren, 0 brothers or sisters, 12 parents, 33 other relatives, 67 non-relatives
- In nonfamily households: 630 (178 male householders (151 living alone)), 375 female householders (331 living alone)), 77 nonrelatives
- In group quarters: 121 (all institutionalized)
Size of family households: 563 2-persons, 256 3-persons, 220 4-persons, 83 5-persons, 10 6-persons, 37 7-or-more-persons,
Size of nonfamily households: 482 1-person, 67 2-persons, 4 4-persons,
747 married couples with children.
218 single-parent households (56 men, 162 women).
Private vs. public school enrollment:
Students in private schools in grades 1 to 8 (elementary and middle school): 46
| Here: | 9.2% |
| Iowa: | 10.8% |
Students in private schools in grades 9 to 12 (high school): 0
| Here: | 0.0% |
| Iowa: | 7.1% |
Students in private undergraduate colleges: 22
| Here: | 19.3% |
| Iowa: | 25.4% |