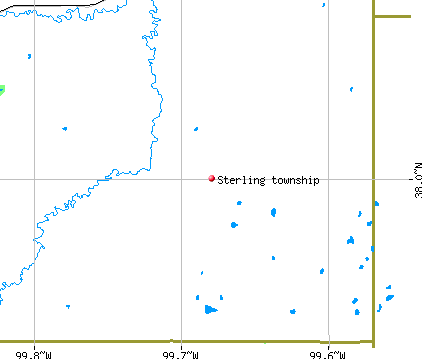
Sterling township, Hodgeman County, Kansas (KS) detailed profile
Land area: 144.2 sq. mi.
Water area: 0.0 sq. mi.
Population: 144 (all rural)
| Males: 77 | |
| Females: 67 |
Occupied houses/apartments: 144 (115 owner occupied, 29 renter occupied)
| % of renters here: | 20% |
| State: | 31% |
Races in Sterling township:
- White Non-Hispanic: 100.0%
Median age of males: 38.3
Median age of females: 38.5
Discuss Kansas on our huge forum. We have over 16 million posts!
Average household size: 3.20
| Sterling township: | 3.2 people |
| Kansas: | 2.5 people |
Average family size: 3.51
| Sterling township: | $52,008 |
| Kansas: | $50,972 |
| Here: | $335 |
| State: | $569 |
Estimated median house or condo value in 2013: $77,275 (it was $50,300 in 2000)
| : | $77,275 |
| Kansas: | $129,700 |
| Population density: 1 people per square mile | (very low). |
Notable locations in this township outside city limits:
Notable location: Orwell Bridge (A). Display/hide its location on the map
Church in Sterling township: Saint Mary's Catholic Church (A). Display/hide its location on the map
Creeks: Rock Creek (A), White Woman Creek (B). Display/hide their locations on the map
74% of Sterling township residents lived in the same house 5 years ago.
Out of people who lived in different houses, 14% lived in this county.
Out of people who lived in different counties, 100% lived in Kansas.
Place of birth for U.S.-born residents:
- This state: 114
- Northeast: 0
- Midwest: 1
- South: 22
- West: 2
Percentage of households with unmarried partners: 2.2%
No gay or lesbian households reported

Housing units in structures:
- One, detached: 47
- Mobile homes: 2
Median worth of mobile homes: $32,500
Housing units in Sterling township with a mortgage: 2 (0 second mortgage, 0 home equity loan, 0 both second mortgage and home equity loan)
Houses without a mortgage: 9
- Agriculture, forestry, fishing and hunting (57%)
- Construction (17%)
- Motor vehicle and parts dealers (10%)
- Social assistance (10%)
- Food and beverage stores (7%)
- Accommodation and food services (24%)
- Public administration (24%)
- Retail florists (14%)
- Construction (10%)
- Food (10%)
- Finance and insurance (10%)
- Administrative and support and waste management services (10%)
- Farmers and farm managers (50%)
- Building and grounds cleaning and maintenance occupations (10%)
- Vehicle and mobile equipment mechanics, installers, and repairers (10%)
- Supervisors and other personal care and service workers except personal appearance, transportation, and child care workers (7%)
- Other sales and related workers including supervisors (7%)
- Construction laborers (7%)
- Electrical equipment mechanics and other installation, maintenance, and repair occupations including supervisors (7%)
- Art and design workers (14%)
- Waiters and waitresses (14%)
- Customer service representatives (14%)
- Cooks and food preparation workers (10%)
- Building and grounds cleaning and maintenance occupations (10%)
- Financial clerks except bookkeeping, accounting, and auditing clerks (10%)
- Secretaries and administrative assistants (10%)
Most common first ancestries reported in Sterling township:
- German (36.6%)
- United States or American (21.8%)
- Irish (11.9%)
- Czech (10.9%)
- Dutch (2.0%)
- Polish (2.0%)
Means of transportation to work:
- Drove a car alone: 39 (76%)
- Carpooled: 4 (8%)
- Worked at home: 8 (16%)
96.3% of residents of Sterling township speak English at home.
3.7% of residents speak Spanish at home (40% speak English very well, 60% speak English well).
Household type by relationship:
Households: 139- In family households: 133 (26 male householders, 0 female householders)
30 spouses, 62 children (50 natural, 0 adopted, 12 stepchildren), 0 grandchildren, 0 brothers or sisters, 6 parents, 9 other relatives, 0 non-relatives
- In nonfamily households: 6 (3 male householders (3 living alone)), 3 female householders (3 living alone)), 0 nonrelatives
Size of family households: 6 2-persons, 2 3-persons, 7 4-persons, 2 5-persons, 7 6-persons, 2 7-or-more-persons,
Size of nonfamily households: 6 1-person,
49 married couples with children.
3 single-parent households (3 men, 0 women).
Private vs. public school enrollment:
Students in private schools in grades 1 to 8 (elementary and middle school): 2
| Here: | 4.7% |
| Kansas: | 11.1% |
Students in private schools in grades 9 to 12 (high school): 0
| Here: | 0.0% |
| Kansas: | 7.9% |
Students in private undergraduate colleges: 0
| Here: | 0.0% |
| Kansas: | 13.8% |