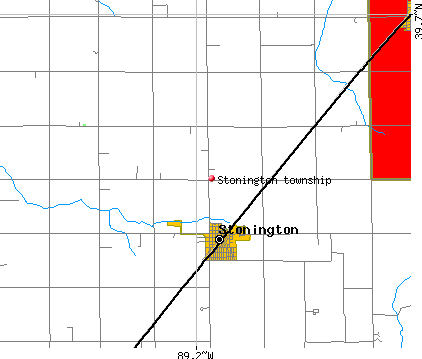
Stonington township, Christian County, Illinois (IL) detailed profile
Number of foreign born residents: 0 (0% naturalized citizens)
| Stonington township: | 0.3% |
| Whole state: | 12.3% |
59% of Stonington township residents lived in the same house 5 years ago.
Out of people who lived in different houses, 56% lived in this county.
Out of people who lived in different counties, 76% lived in Illinois.
Place of birth for U.S.-born residents:
- This state: 984
- Northeast: 4
- Midwest: 56
- South: 50
- West: 39
Median price asked for vacant for-sale houses in 2000: $29,200
Percentage of households with unmarried partners: 3.4%
Likely homosexual households (counted as self-reported same-sex unmarried-partner households)
- Lesbian couples: 0.6% of all households
- Gay men: 0.0% of all households

Housing units in structures:
- One, detached: 420
- One, attached: 6
- Two: 20
- 3 or 4: 12
- 5 to 9: 13
- 10 to 19: 2
- Mobile homes: 25
Median worth of mobile homes: $18,600
Housing units in Stonington township with a mortgage: 162 (11 second mortgage, 15 home equity loan, 0 both second mortgage and home equity loan)
Houses without a mortgage: 143
- Agriculture, forestry, fishing and hunting (12%)
- Food (8%)
- Plastics and rubber products (8%)
- Construction (6%)
- Professional, scientific, and technical services (6%)
- Truck transportation (5%)
- Accommodation and food services (5%)
- Health care (20%)
- Educational services (14%)
- Professional, scientific, and technical services (6%)
- Food and beverage stores (6%)
- Finance and insurance (6%)
- Social assistance (5%)
- Public administration (4%)
- Other production occupations including supervisors (12%)
- Electrical equipment mechanics and other installation, maintenance, and repair occupations including supervisors (11%)
- Driver/sales workers and truck drivers (9%)
- Farmers and farm managers (6%)
- Cooks and food preparation workers (5%)
- Other sales and related workers including supervisors (4%)
- Laborers and material movers, hand (4%)
- Other sales and related workers including supervisors (8%)
- Preschool, kindergarten, elementary and middle school teachers (7%)
- Information and record clerks except customer service representatives (7%)
- Secretaries and administrative assistants (7%)
- Other office and administrative support workers including supervisors (6%)
- Building and grounds cleaning and maintenance occupations (5%)
- Nursing, psychiatric, and home health aides (4%)
Most common first ancestries reported in Stonington township:
- German (27.8%)
- United States or American (15.6%)
- English (12.7%)
- Irish (10.4%)
- French (except Basque) (7.4%)
- Italian (6.8%)
- Scottish (4.2%)
Most common places of birth for the foreign-born residents:
- Mexico (100%)
Means of transportation to work:
- Drove a car alone: 387 (81%)
- Carpooled: 61 (13%)
- Bus or trolley bus: 2 (0%)
- Walked: 7 (1%)
- Worked at home: 21 (4%)
Most commonly used house heating fuel:
- Utility gas (84%)
- Bottled, tank, or LP gas (12%)
- Electricity (3%)
97.9% of residents of Stonington township speak English at home.
1.3% of residents speak Spanish at home (93% speak English very well, 7% speak English well).
0.6% of residents speak other Indo-European language at home (100% speak English very well).
0.2% of residents speak Asian or Pacific Island language at home (100% speak English not well).
Household type by relationship:
Households: 1,142- In family households: 999 (297 male householders, 36 female householders)
276 spouses, 358 children (325 natural, 6 adopted, 27 stepchildren), 1 grandchildren, 4 brothers or sisters, 4 parents, 10 other relatives, 13 non-relatives
- In nonfamily households: 143 (50 male householders (41 living alone)), 74 female householders (68 living alone)), 19 nonrelatives
- In group quarters: 1 (0 institutionalized population)
Size of family households: 169 2-persons, 64 3-persons, 69 4-persons, 24 5-persons, 7 6-persons,
Size of nonfamily households: 109 1-person, 13 2-persons, 2 4-persons,
240 married couples with children.
60 single-parent households (20 men, 40 women).
Private vs. public school enrollment:
Students in private schools in grades 1 to 8 (elementary and middle school): 20
| Here: | 12.2% |
| Illinois: | 13.4% |
Students in private schools in grades 9 to 12 (high school): 6
| Here: | 10.2% |
| Illinois: | 11.1% |
Students in private undergraduate colleges: 0
| Here: | 0.0% |
| Illinois: | 25.8% |