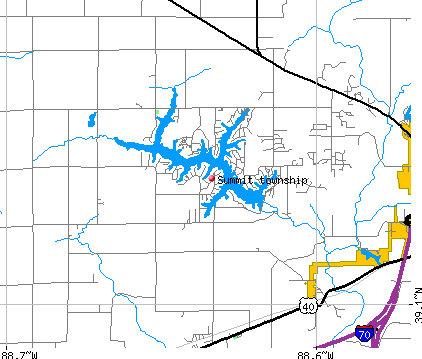
Summit township, Effingham County, Illinois (IL) detailed profile
Number of foreign born residents: 1 (74% naturalized citizens)
| Summit township: | 1.2% |
| Whole state: | 12.3% |
61% of Summit township residents lived in the same house 5 years ago.
Out of people who lived in different houses, 67% lived in this county.
Out of people who lived in different counties, 61% lived in Illinois.
Place of birth for U.S.-born residents:
- This state: 2745
- Northeast: 71
- Midwest: 264
- South: 148
- West: 57
Median price asked for vacant for-sale houses in 2000: $167,900
Percentage of households with unmarried partners: 2.9%
Likely homosexual households (counted as self-reported same-sex unmarried-partner households)
- Lesbian couples: 0.0% of all households
- Gay men: 0.1% of all households

Housing units in structures:
- One, detached: 1,349
- One, attached: 10
- Two: 15
- 3 or 4: 17
- Mobile homes: 62
Median worth of mobile homes: $33,400
Housing units in Summit township with a mortgage: 688 (57 second mortgage, 94 home equity loan, 0 both second mortgage and home equity loan)
Houses without a mortgage: 248
- Construction (13%)
- Printing and related support activities (6%)
- Repair and maintenance (6%)
- Public administration (5%)
- Finance and insurance (5%)
- Truck transportation (5%)
- Health care (4%)
- Health care (14%)
- Educational services (11%)
- Finance and insurance (7%)
- Accommodation and food services (6%)
- Public administration (6%)
- Food and beverage stores (6%)
- Social assistance (5%)
- Other management occupations except farmers and farm managers (7%)
- Other sales and related workers including supervisors (6%)
- Driver/sales workers and truck drivers (6%)
- Electrical equipment mechanics and other installation, maintenance, and repair occupations including supervisors (5%)
- Top executives (4%)
- Sales representatives, services, wholesale and manufacturing (4%)
- Other production occupations including supervisors (4%)
- Secretaries and administrative assistants (10%)
- Other office and administrative support workers including supervisors (6%)
- Registered nurses (6%)
- Preschool, kindergarten, elementary and middle school teachers (6%)
- Other sales and related workers including supervisors (5%)
- Information and record clerks except customer service representatives (5%)
- Retail sales workers except cashiers (4%)
Most common first ancestries reported in Summit township:
- German (50.8%)
- United States or American (15.6%)
- English (6.8%)
- Irish (5.5%)
- Polish (2.9%)
- French (except Basque) (2.6%)
- Dutch (2.1%)
Most common places of birth for the foreign-born residents:
- China, excluding Hong Kong and Taiwan (29%)
- Germany (24%)
- Canada (14%)
- France (12%)
- Other Central America (12%)
- Philippines (10%)
Means of transportation to work:
- Drove a car alone: 1,587 (89%)
- Carpooled: 141 (8%)
- Other means: 8 (0%)
- Worked at home: 45 (3%)
Most commonly used house heating fuel:
- Utility gas (53%)
- Bottled, tank, or LP gas (24%)
- Electricity (19%)
- Wood (3%)
- Fuel oil, kerosene, etc. (1%)
98.3% of residents of Summit township speak English at home.
0.6% of residents speak Spanish at home (100% speak English very well).
0.4% of residents speak other Indo-European language at home (100% speak English very well).
0.6% of residents speak Asian or Pacific Island language at home (20% speak English very well, 60% speak English well, 20% speak English not well).
Household type by relationship:
Households: 3,331- In family households: 3,083 (906 male householders, 117 female householders)
879 spouses, 1,053 children (942 natural, 35 adopted, 76 stepchildren), 28 grandchildren, 14 brothers or sisters, 22 parents, 12 other relatives, 52 non-relatives
- In nonfamily households: 248 (109 male householders (93 living alone)), 107 female householders (103 living alone)), 32 nonrelatives
Size of family households: 462 2-persons, 213 3-persons, 223 4-persons, 82 5-persons, 41 6-persons, 2 7-or-more-persons,
Size of nonfamily households: 196 1-person, 17 2-persons, 3 6-persons,
815 married couples with children.
100 single-parent households (29 men, 71 women).
Private vs. public school enrollment:
Students in private schools in grades 1 to 8 (elementary and middle school): 193
| Here: | 42.1% |
| Illinois: | 13.4% |
Students in private schools in grades 9 to 12 (high school): 35
| Here: | 17.5% |
| Illinois: | 11.1% |
Students in private undergraduate colleges: 6
| Here: | 4.2% |
| Illinois: | 25.8% |