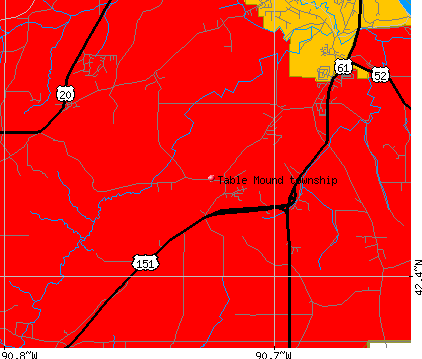
Table Mound township, Dubuque County, Iowa (IA) detailed profile
Land area: 34.3 sq. mi.
Water area: 0.0 sq. mi.
Population: 3,617 (22% urban, 78% rural)
| Males: 1,820 | |
| Females: 1,797 |
Occupied houses/apartments: 3,617 (3,391 owner occupied, 226 renter occupied)
| % of renters here: | 6% |
| State: | 28% |
Races in Table Mound township:
- White Non-Hispanic: 98.6%
- Black: 0.2%
- American Indian and Alaska Native: 0.1%
- Asian: 0.2%
- Two or more races: 0.3%
Median age of males: 35.5
Median age of females: 35.6
Discuss Iowa on our huge forum. We have over 16 million posts!
Average household size: 2.79
| Table Mound township: | 2.8 people |
| Iowa: | 2.5 people |
Average family size: 3.09
| Table Mound township: | $51,735 |
| Iowa: | $52,229 |
| Here: | $548 |
| State: | $554 |
Estimated median house or condo value in 2013: $146,100 (it was $91,900 in 2000)
| : | $146,100 |
| Iowa: | $126,900 |
Mean price in 2013:
Detached houses: $183,041
Here: $183,041 State: $159,697
Townhouses or other attached units: $289,722
Here: $289,722 State: $193,868
In 2-unit structures: $121,480
Here: $121,480 State: $120,896
In 3-to-4-unit structures: $152,884
Here: $152,884 State: $122,004
In 5-or-more-unit structures: $120,426
Here: $120,426 State: $118,952
Mobile homes: $58,705
Here: $58,705 State: $46,008
| Population density: 105 people per square mile | (average). |
| This township: | 3.2% |
| Whole state: | 9.1% |
| This township: | 1.8% |
| Whole state: | 3.8% |
Notable locations in this township outside city limits:
Notable locations in Table Mound township: Buncombe (A), Waller School (B), Swiss Valley Nature Center (C), Key West Community Fire Department (D), Dubuque Regional Airport (E). Display/hide their locations on the map
Churches in Table Mound township include: Saint Joseph Church (A), Reeds Chapel (B). Display/hide their locations on the map
Cemeteries: Dubuque Memorial Gardens Cemetery (1), French Cemetery (2), Rooney Cemetery (3), Sisters of Charity Cemetery (4), Reeds Chapel Methodist Cemetery (5), Presentation Sisters Cemetery (6), Mount Olivet Cemetery (7). Display/hide their locations on the map
Parks in Table Mound township include: Swiss Valley Park (1), FDR Park (2). Display/hide their locations on the map
63% of Table Mound township residents lived in the same house 5 years ago.
Out of people who lived in different houses, 83% lived in this county.
Out of people who lived in different counties, 17% lived in Iowa.
Place of birth for U.S.-born residents:
- This state: 2931
- Northeast: 59
- Midwest: 450
- South: 76
- West: 77
Percentage of households with unmarried partners: 4.9%
Likely homosexual households (counted as self-reported same-sex unmarried-partner households)
- Lesbian couples: 0.2% of all households
- Gay men: 0.2% of all households
Housing units in structures:
- One, detached: 903
- One, attached: 8
- Two: 30
- 3 or 4: 8
- 5 to 9: 4
- Mobile homes: 381
Median worth of mobile homes: $9,999
Housing units in Table Mound township with a mortgage: 503 (34 second mortgage, 146 home equity loan, 0 both second mortgage and home equity loan)
Houses without a mortgage: 205
- Construction (10%)
- Machinery (9%)
- Agriculture, forestry, fishing and hunting (6%)
- Health care (6%)
- Educational services (6%)
- Miscellaneous manufacturing (4%)
- Administrative and support and waste management services (4%)
- Health care (21%)
- Accommodation and food services (10%)
- Educational services (10%)
- Finance and insurance (5%)
- Department and other general merchandise stores (4%)
- Publishing, and motion picture and sound recording industries (4%)
- Arts, entertainment, and recreation (3%)
- Other sales and related workers including supervisors (6%)
- Other management occupations except farmers and farm managers (6%)
- Sales representatives, services, wholesale and manufacturing (6%)
- Other production occupations including supervisors (6%)
- Farmers and farm managers (5%)
- Metal workers and plastic workers (5%)
- Building and grounds cleaning and maintenance occupations (4%)
- Other office and administrative support workers including supervisors (9%)
- Registered nurses (8%)
- Cashiers (7%)
- Retail sales workers except cashiers (5%)
- Health technologists and technicians (5%)
- Bookkeeping, accounting, and auditing clerks (4%)
- Customer service representatives (4%)
Most common first ancestries reported in Table Mound township:
- German (51.1%)
- Irish (18.1%)
- United States or American (13.9%)
- English (3.8%)
- Norwegian (2.4%)
- Dutch (1.2%)
- Austrian (1.1%)
Means of transportation to work:
- Drove a car alone: 1,753 (88%)
- Carpooled: 117 (6%)
- Taxi: 7 (0%)
- Walked: 8 (0%)
- Other means: 8 (0%)
- Worked at home: 90 (5%)
Most commonly used house heating fuel:
- Utility gas (47%)
- Bottled, tank, or LP gas (29%)
- Fuel oil, kerosene, etc. (14%)
- Electricity (8%)
- Wood (1%)
96.7% of residents of Table Mound township speak English at home.
1.9% of residents speak Spanish at home (85% speak English very well, 15% speak English not well).
1.4% of residents speak other Indo-European language at home (46% speak English very well, 54% speak English not well).
Household type by relationship:
Households: 3,593- In family households: 3,314 (914 male householders, 136 female householders)
921 spouses, 1,226 children (1,175 natural, 4 adopted, 47 stepchildren), 20 grandchildren, 0 brothers or sisters, 0 parents, 18 other relatives, 79 non-relatives
- In nonfamily households: 279 (120 male householders (100 living alone)), 108 female householders (84 living alone)), 51 nonrelatives
Size of family households: 400 2-persons, 262 3-persons, 238 4-persons, 100 5-persons, 50 6-persons,
Size of nonfamily households: 184 1-person, 44 2-persons,
862 married couples with children.
144 single-parent households (53 men, 91 women).
Private vs. public school enrollment:
Students in private schools in grades 1 to 8 (elementary and middle school): 168
| Here: | 38.1% |
| Iowa: | 10.8% |
Students in private schools in grades 9 to 12 (high school): 24
| Here: | 11.0% |
| Iowa: | 7.1% |
Students in private undergraduate colleges: 43
| Here: | 45.3% |
| Iowa: | 25.4% |